Overview
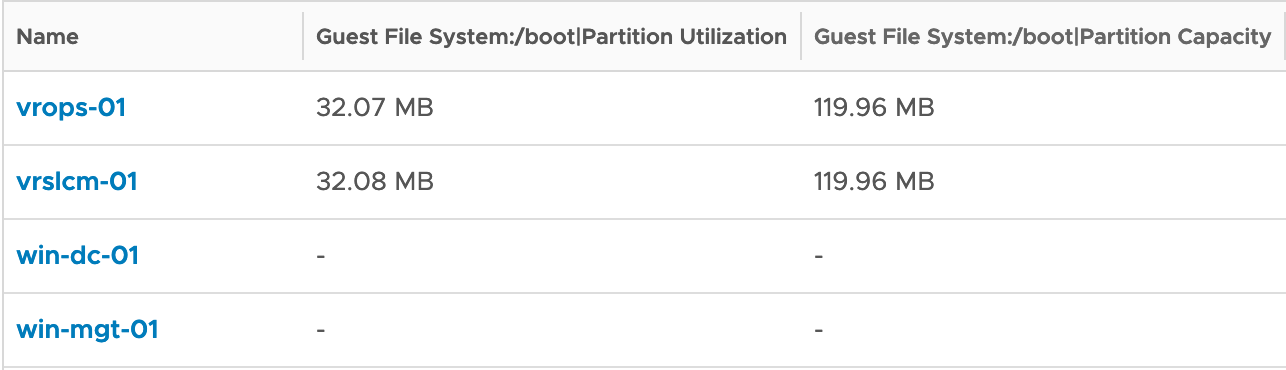
Back in my operational days, my team and I needed ‘pretty’ reports on all VMs in the environment. In almost every case, we needed to include metrics on Guest OS volumes. Back in vRealize Operations 5.x, 6.x and 7.x, I could never find a way report on all instances of a guest volume on many VMs. It always looked like this:
One of the key use cases for a functioning report is reporting on total drive space, used disk, and space remaining from a guest OS perspective. You can present the findings to the machine owners and work towards reducing excessive footprint in the environment. But, as you can see above, the built-in report from vRealize Operations only gives us summations of the guest OS filesystem instead of a breakdown per filesystem. If you’re wondering, the View above in vRealize Operations View is named Virtual Machine Disk and Filesystem Usage List.
I have been working with one of my customers to build out their dashboard and reporting capabilities. Their requirements were not too different to my description above, so I jumped into vRealize Operations and started exploring Views.
At first, I tried creating a View and just add a combination of filesystems that appeared in the Metrics picker:
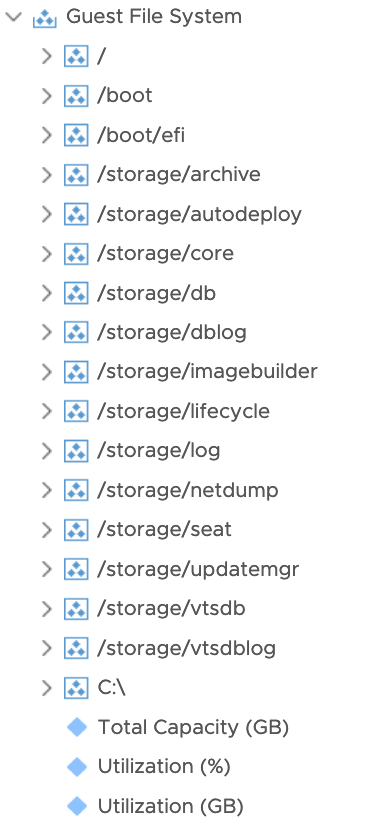
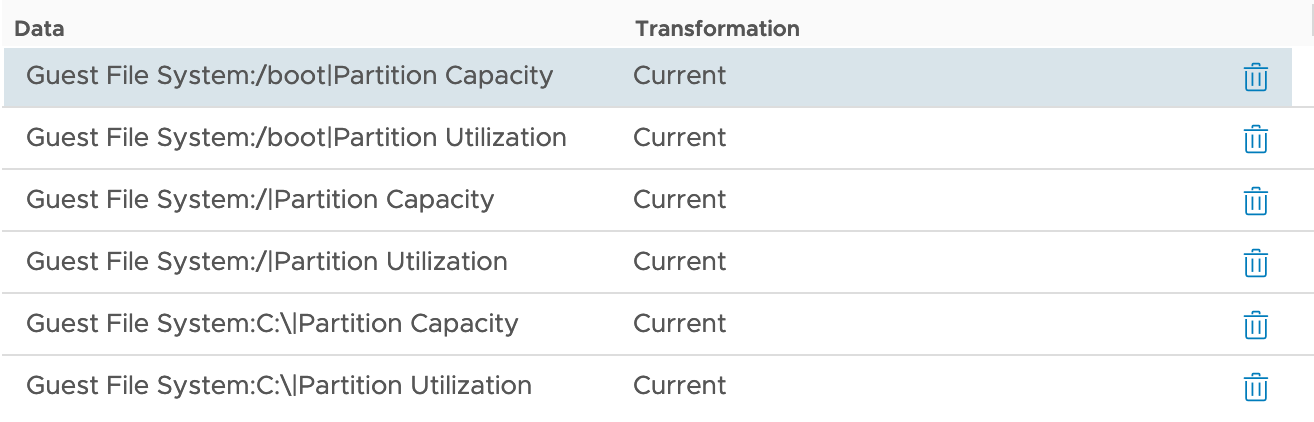
Let’s feed a mix of Linux and Windows VMs as sample data:
You can see that each Metric we have selected has a column, but a cell will display even if the guest doesn’t have a volume with that label. Imagine if we expanded this to all guest filesystems across Windows and Linux. We’d end up with an infinite number of filesystems (Linux mount points can be anything).
When you feed VMs into the out-of-the-box Virtual Machine Disk and Filesystem Usage List, it lists VMs and their guest volume metrics. You will only see metrics for each volume that you define in the view. The View only shows data for the volumes selected. If you have more, it won’t show them. If the volume has a different name to what’s selected, it won’t show. What we need is a method of enumerating guest OS volumes dynamically, regardless of the number of volumes or VMs.
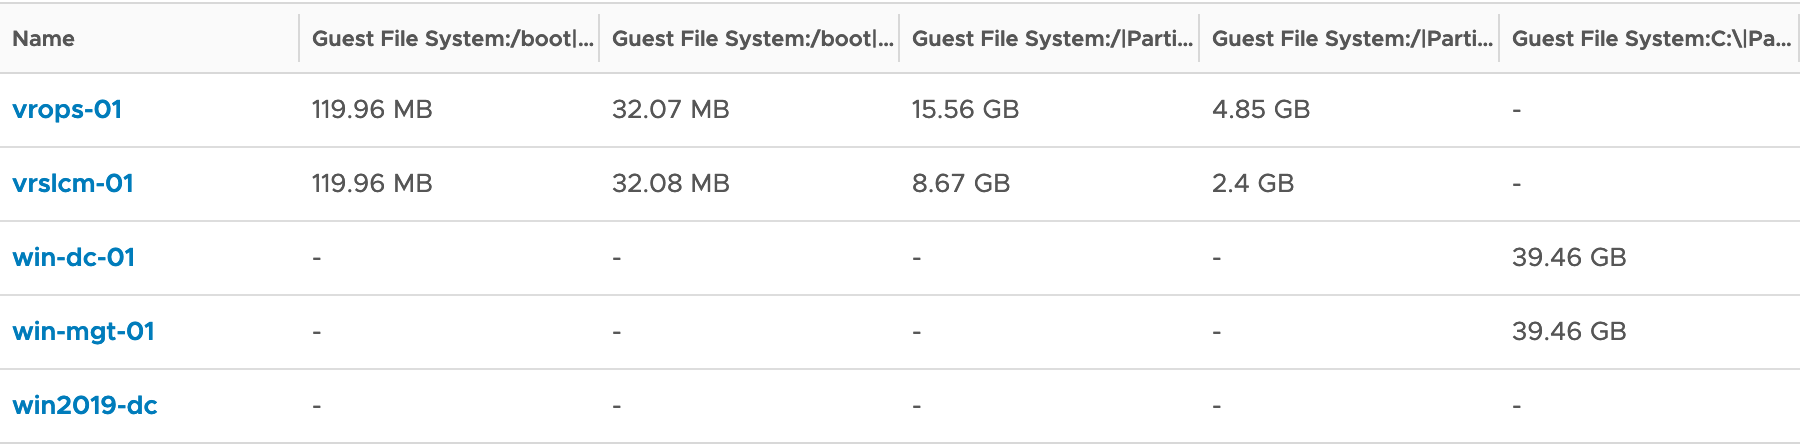
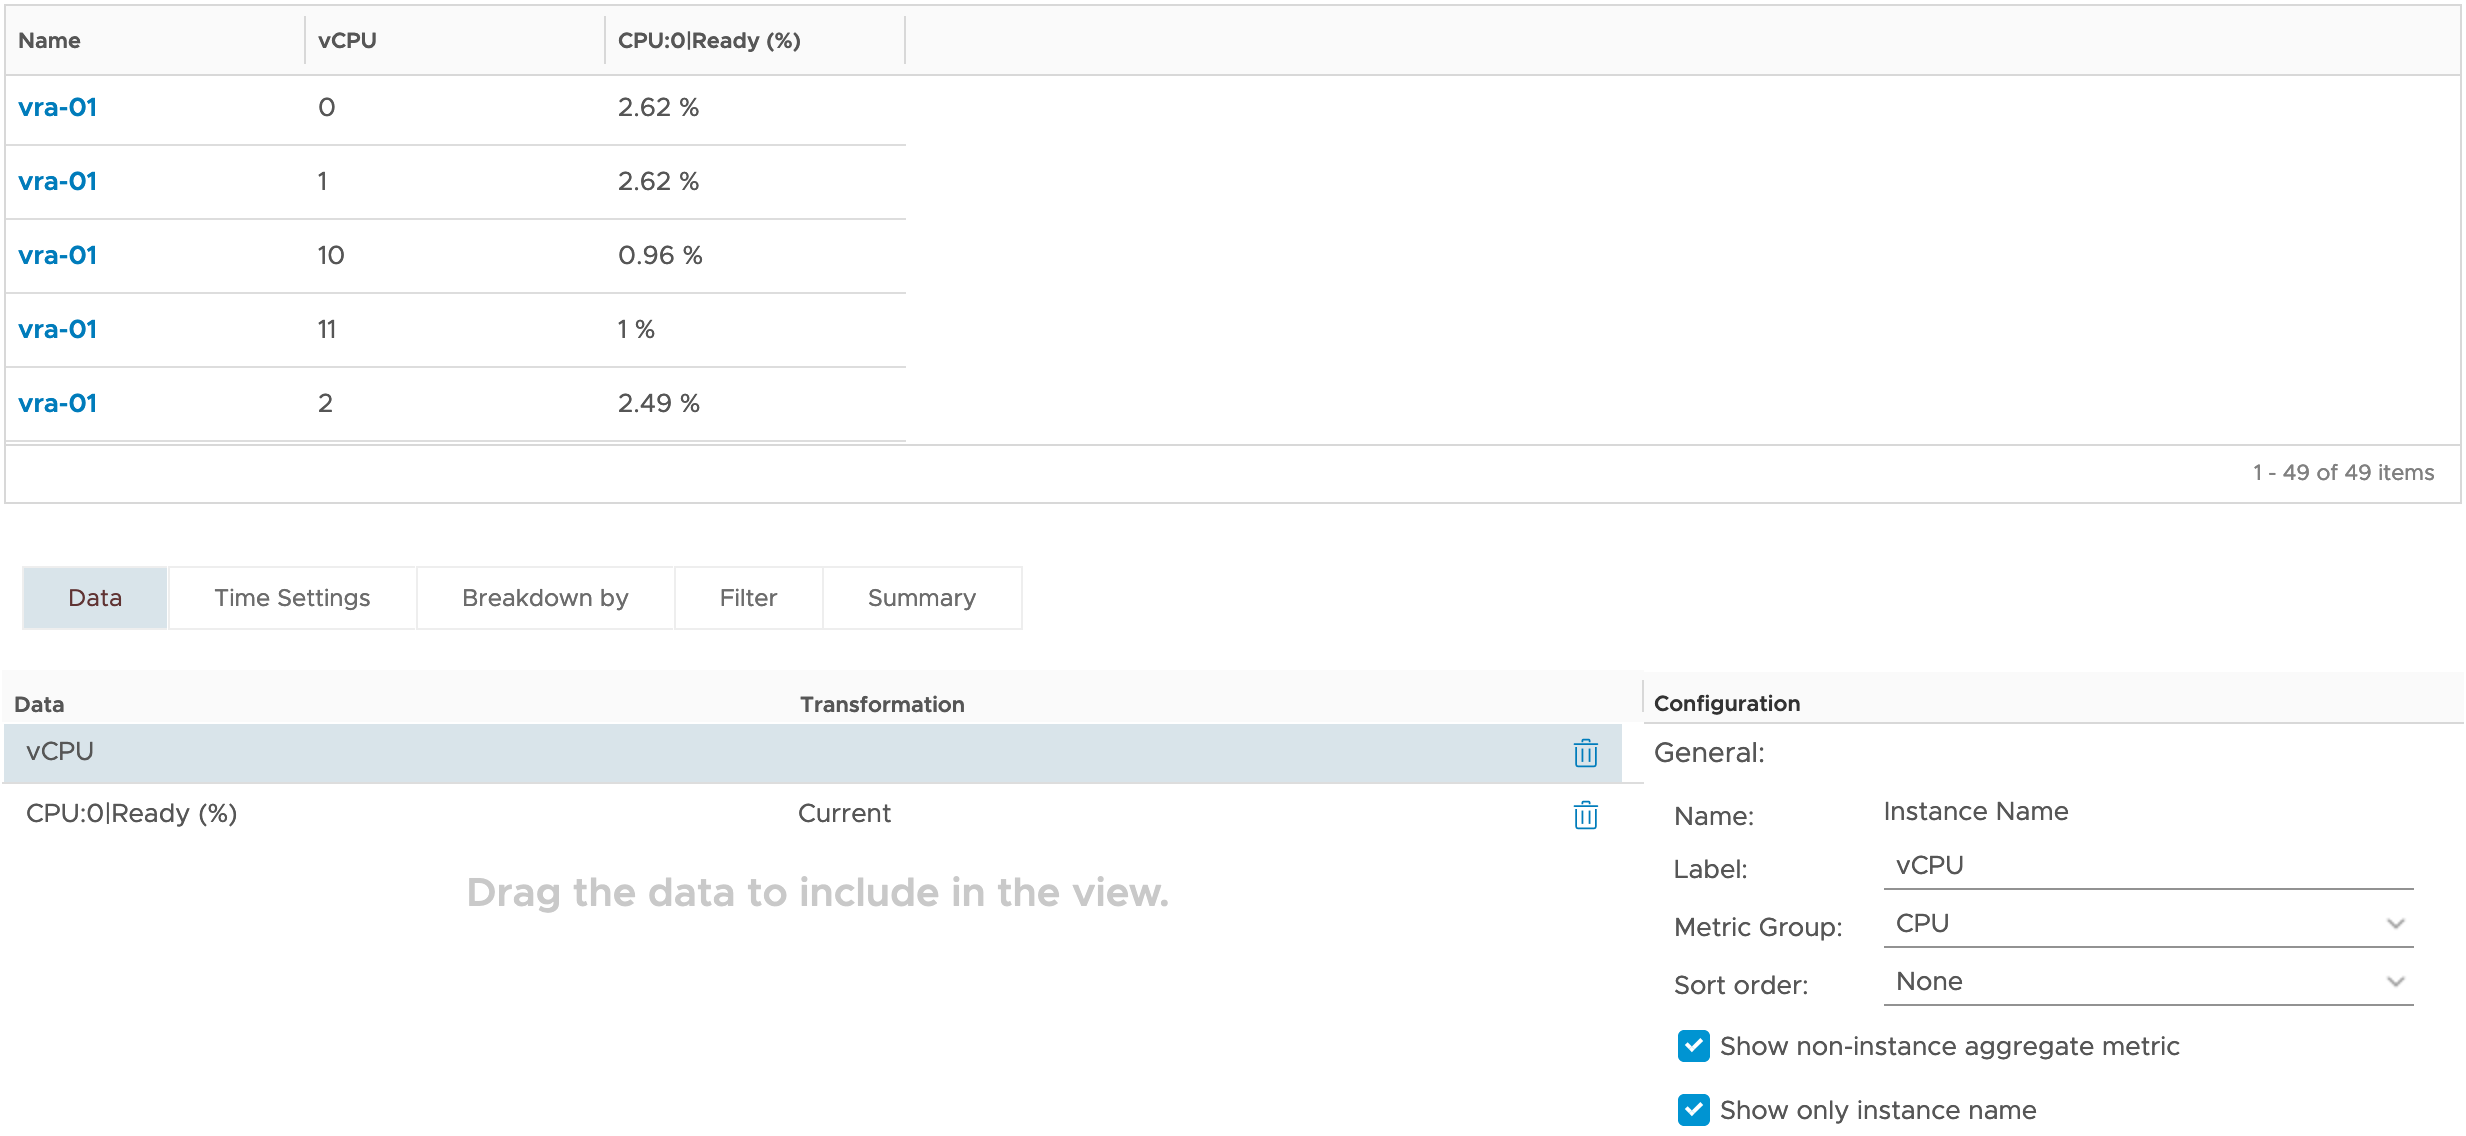
This is achieved using the “Breakdown By” feature in a “List” View in vRealize Operations. We can effectively have vRealize Operations list details of each VM guest volume, but only if it exists. The “Breakdown By” feature allows us to select any metric that may have multiple instances and report on them, regardless of the instance’s properties (for example, filesystem/mount names) and also across guest OS’s. Let me show you how. To show you the beauty of the feature, I will select two metrics from a single Linux filesystem from the metric picker without configuring “Breakdown By”, then feed in Linux and Windows machines as sample data.
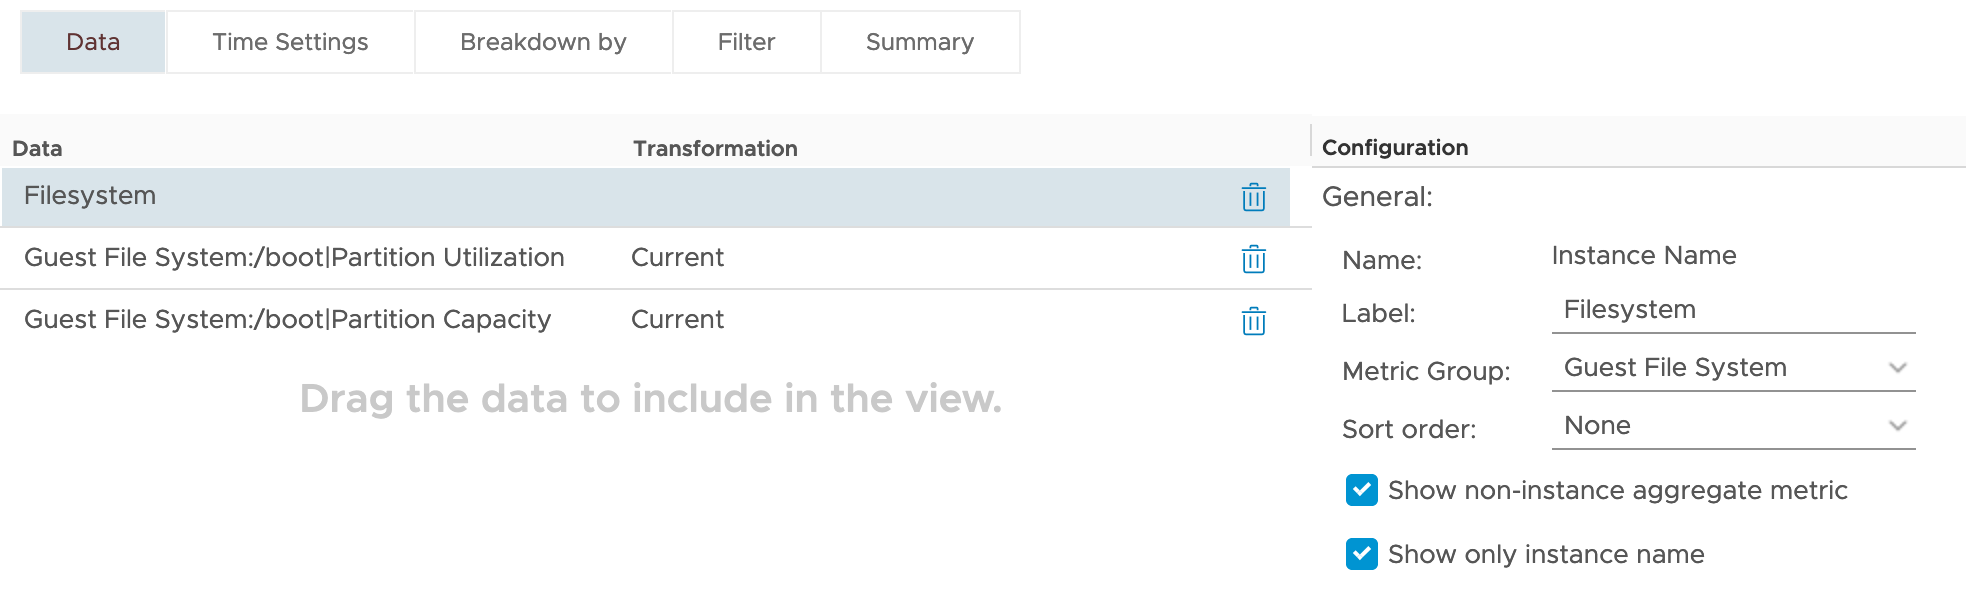
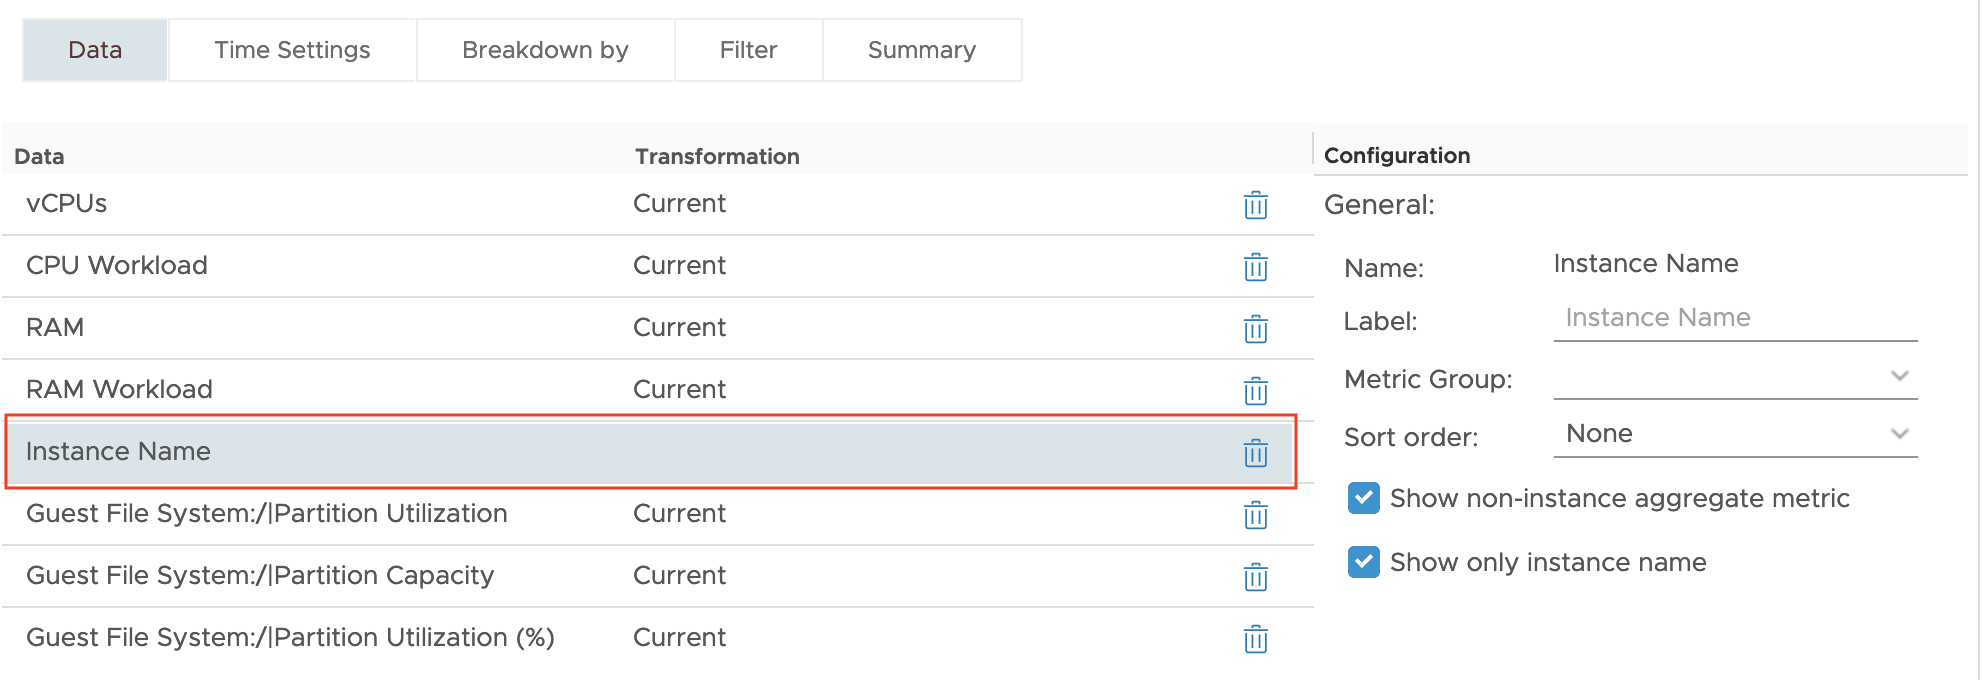
Above, you can see we have 2 Linux machines that have /boot volumes and, as such, have metrics available. The Windows machines do not have /boot volumes and are empty. Without touching the metrics, let’s go to the “Breakdown by” tab and select Add instance breakdown column (see data for column settings). Jumping back to the Data tab, there’s a new metric row simply called “Instance Name”. Select it to see the metric details on the right. This odd-looking metric is the configuration of the Breakdown By setting where we select which metric category we want to enumerate. For our requirements we want the Metric Group value set to Guest File System. Set the Label to something generic like “Filesystem” or “Mount”.
With this small addition, we’re now seeing the following in our sample data:
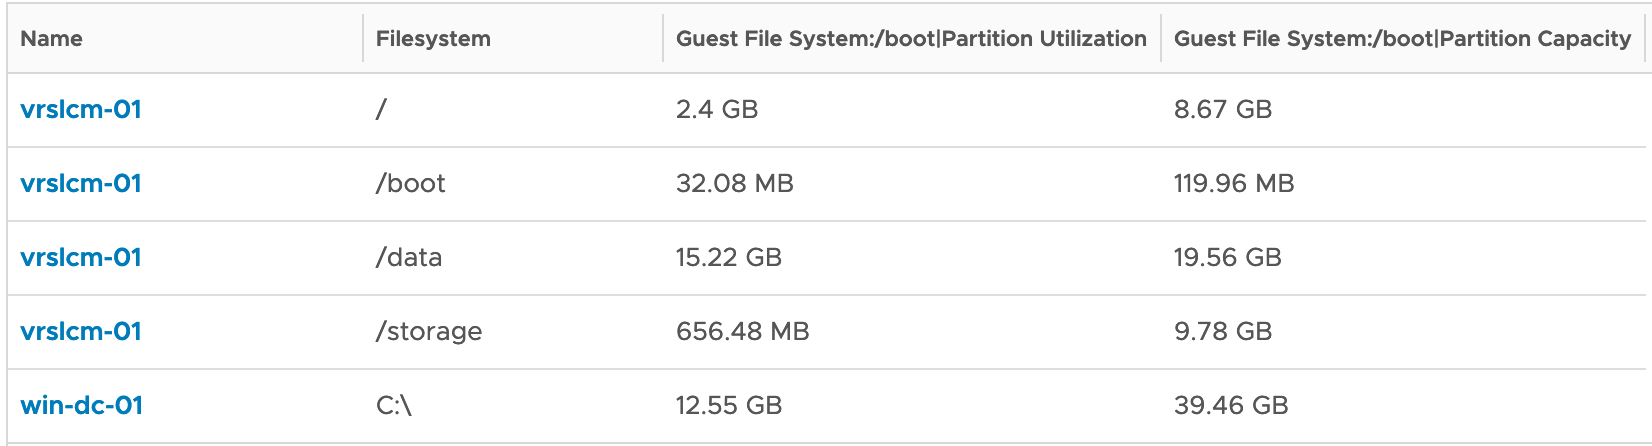
Look at that! Our Windows server filesystem alongside the Linux mounts. However, something you’ll notice is that each filesystem now has its own row. The plus side is that vRealize Operations will only list the filesystems in that VM, instead of listing empty cells and an infinite number of columns.
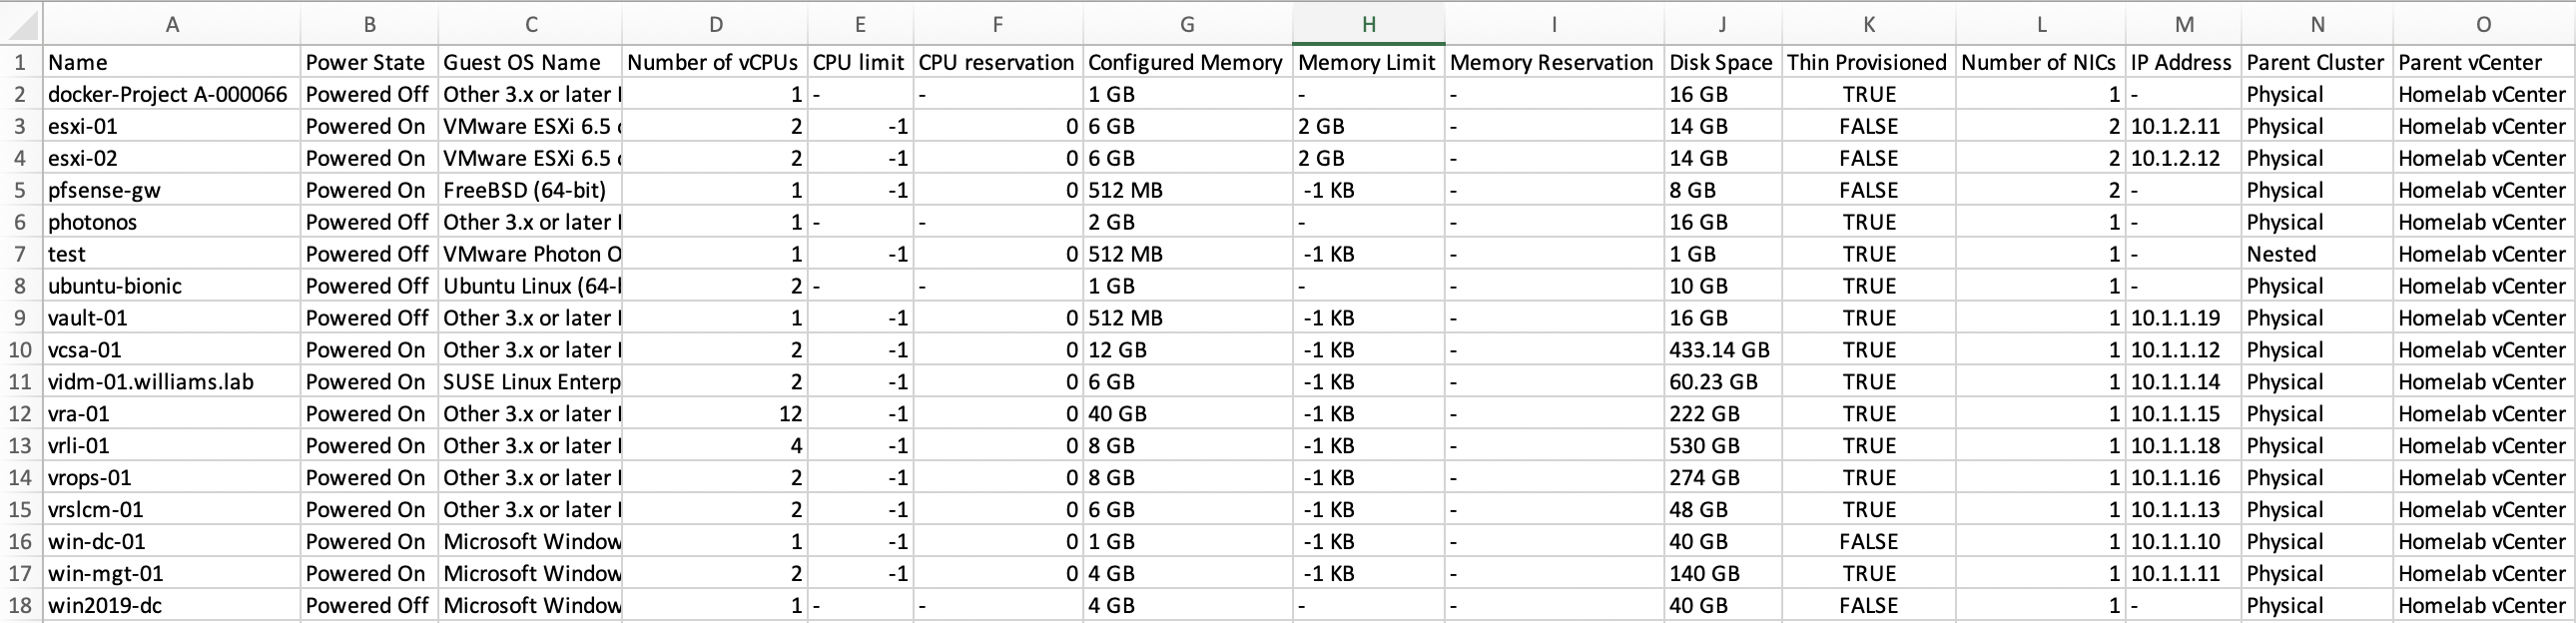
Cleaning this sample up and adding a few more metrics and properties, we can build a useful report for machine owners:
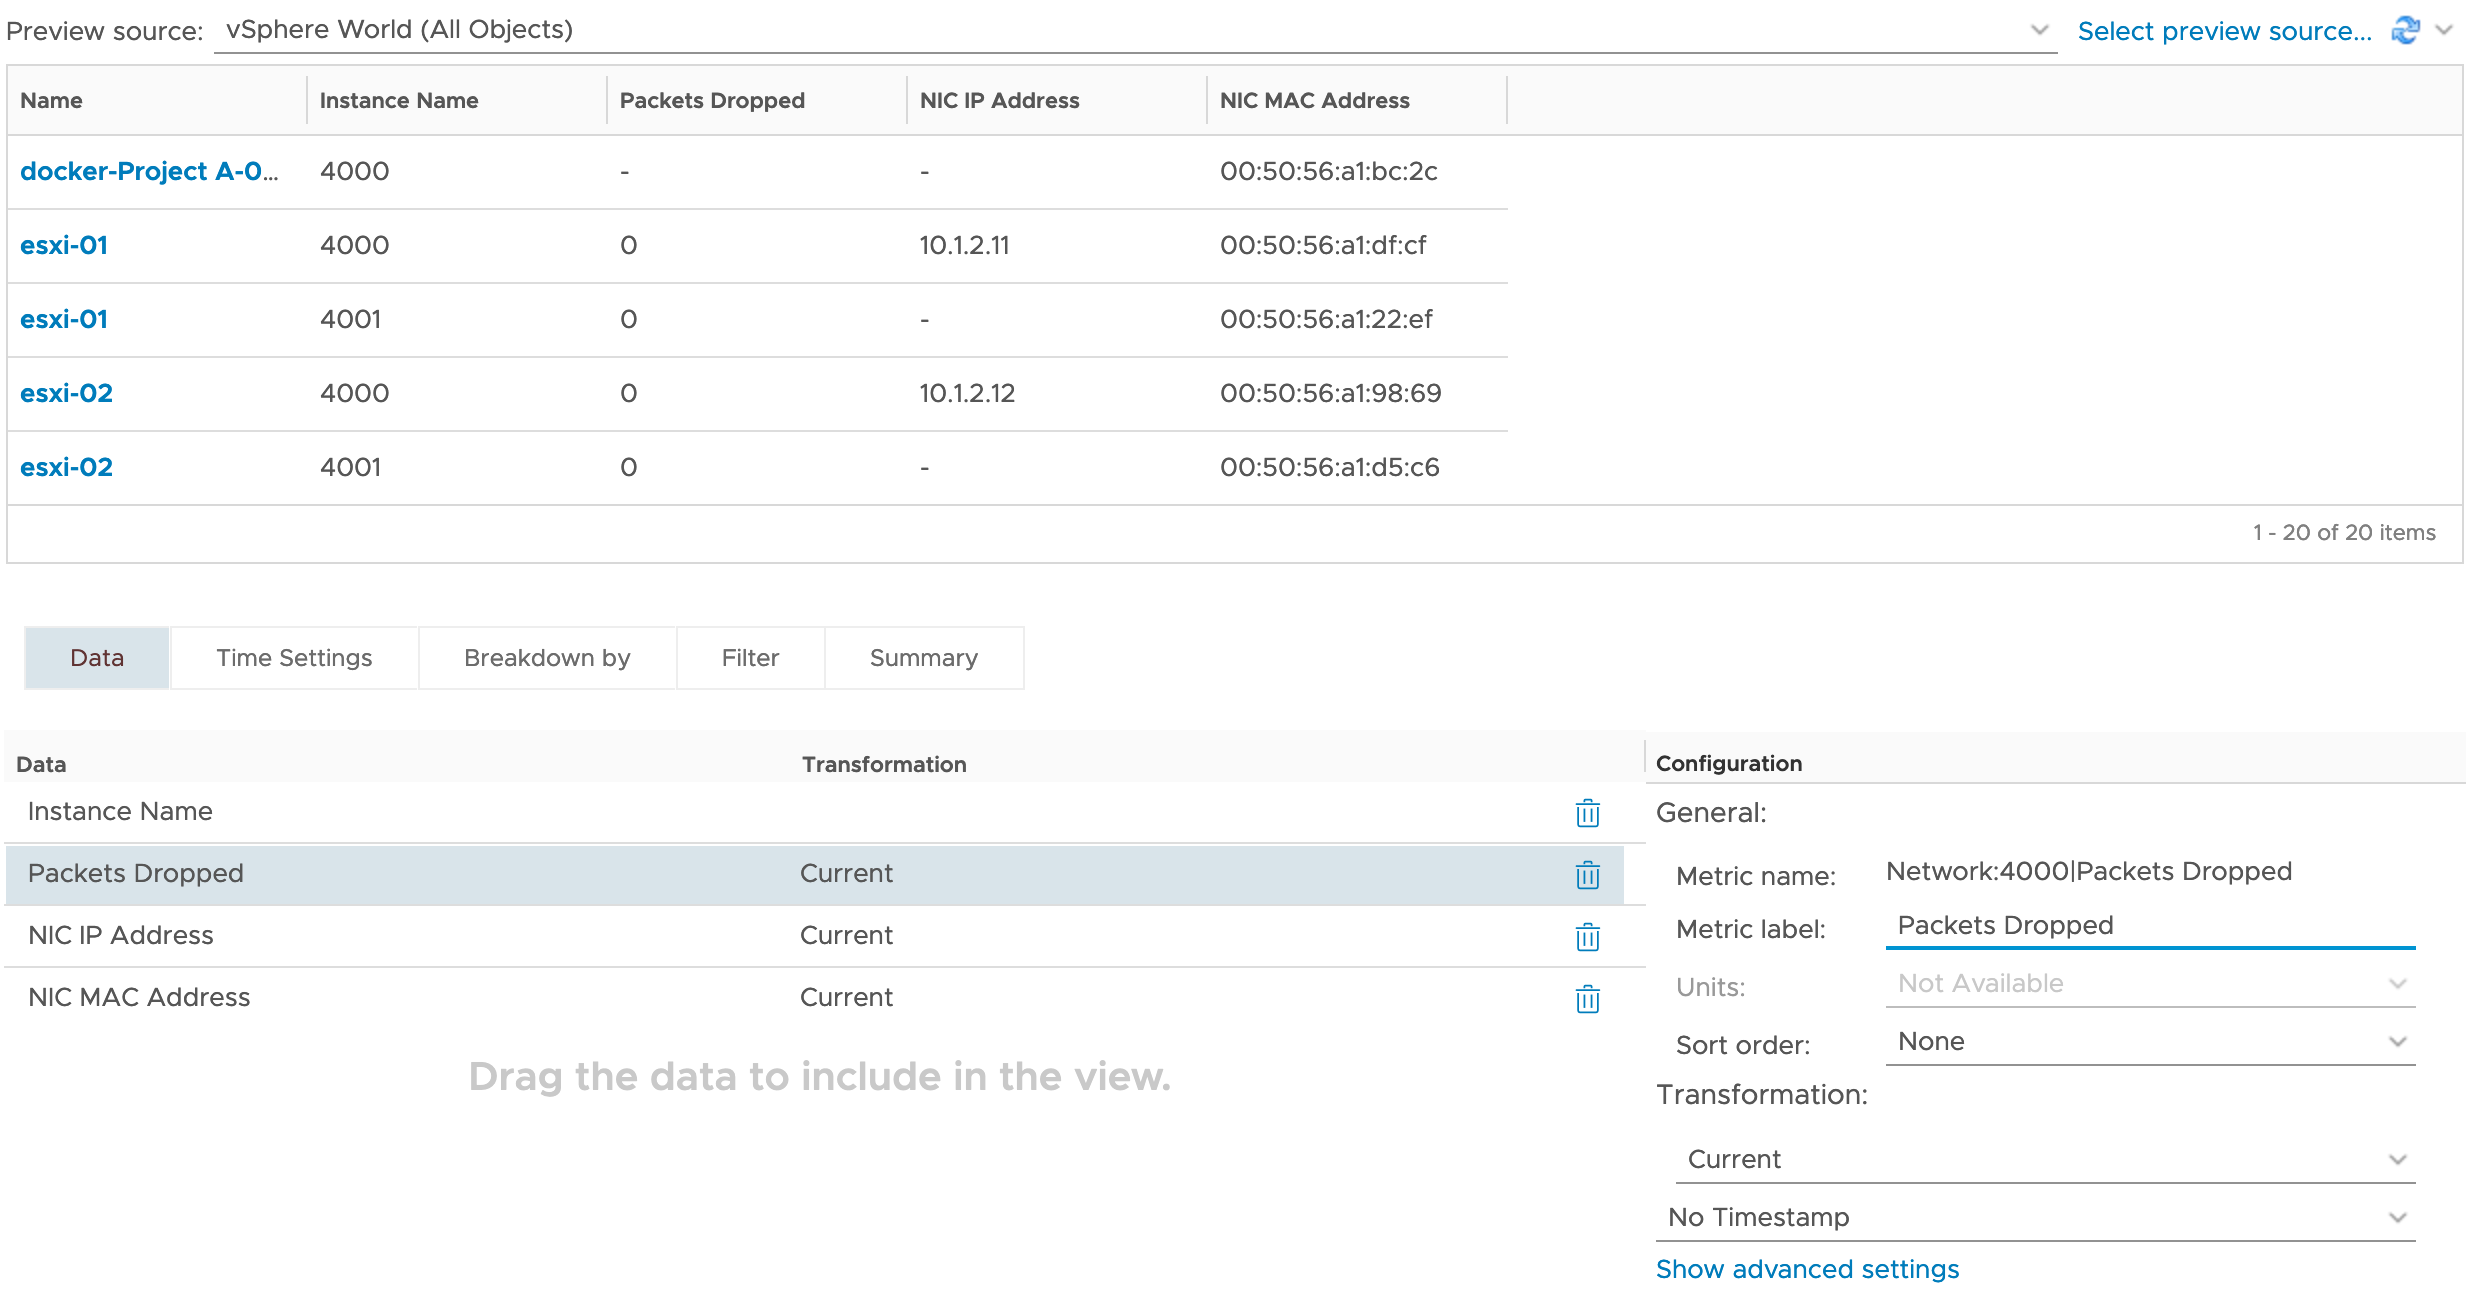
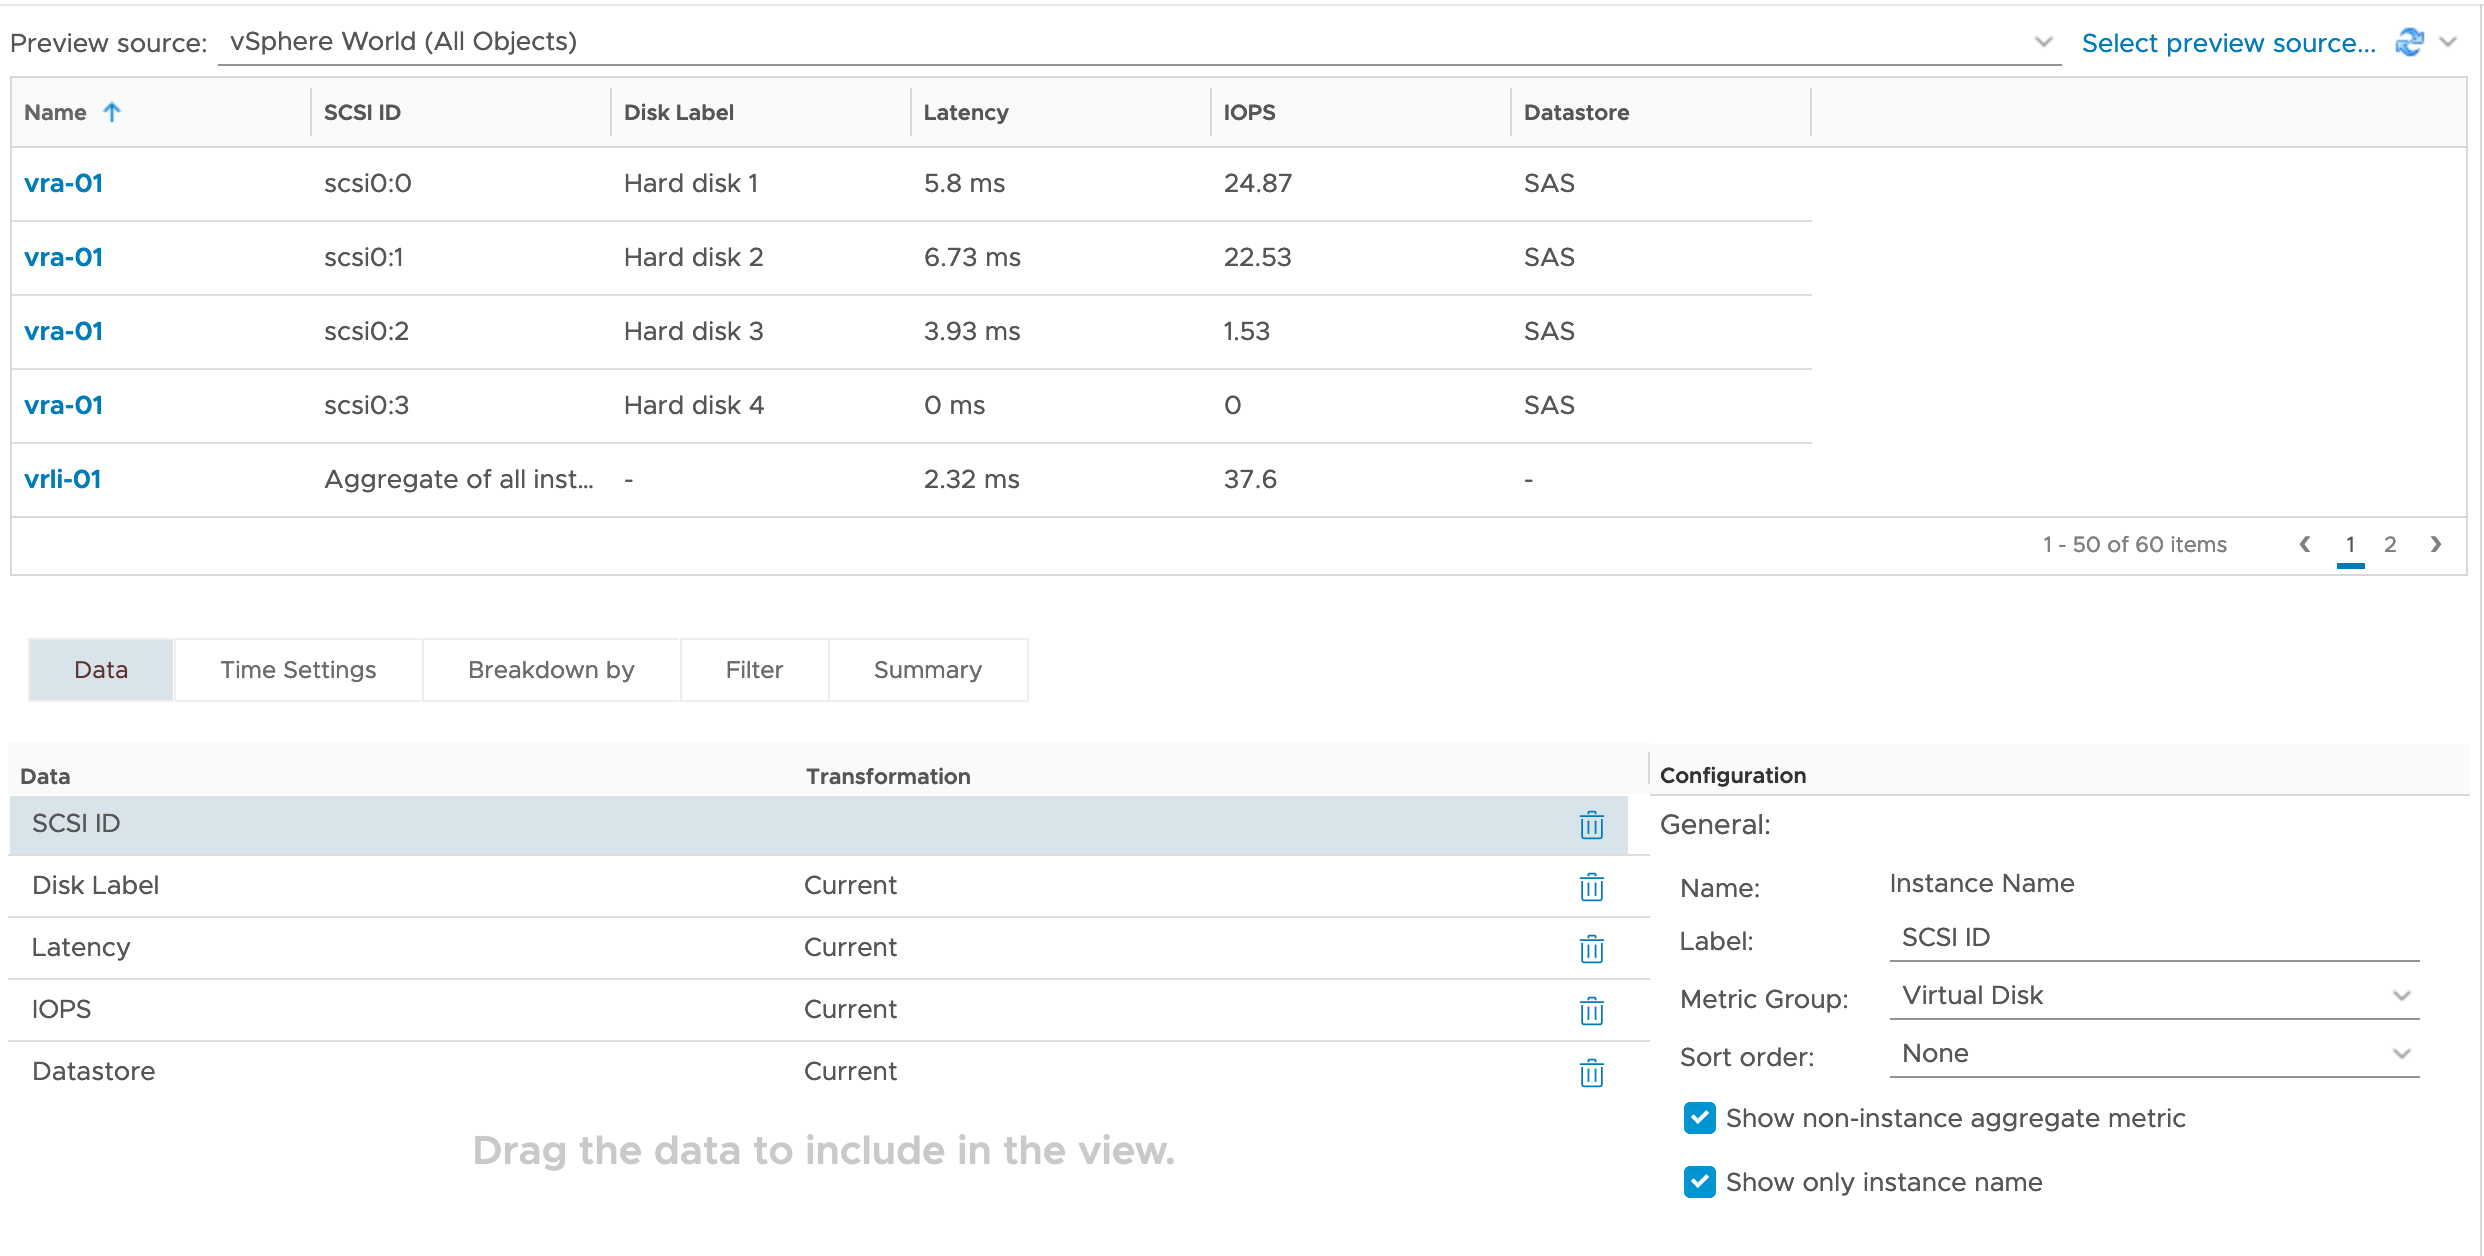
The Breakdown By feature applies to any multi-instance metric such as VMDKs, CPUs, NICs, etc.
Step-by-step
By special request from commenter “CGF”, I’ll show a step-by-step to build this View.
Creating the View
- Log in to your vRealize Operations instance.
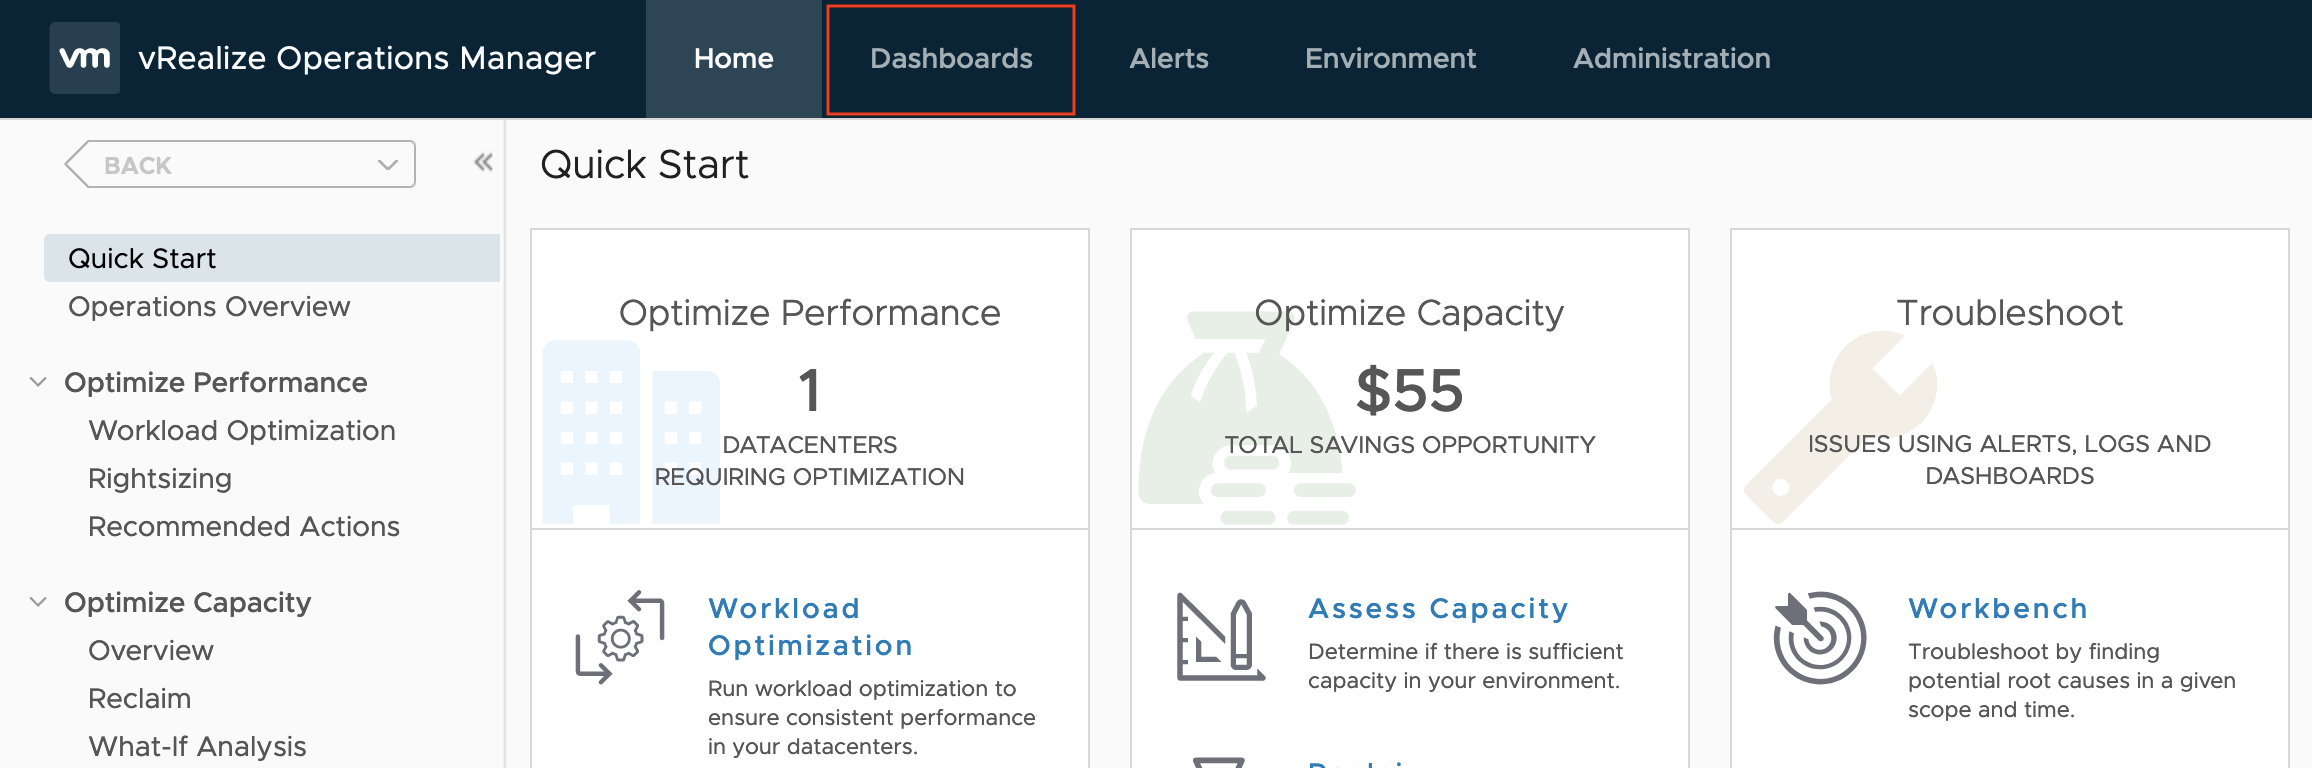
- Click Dashboards at the top of the page.
- Click Views in the left hand menu.
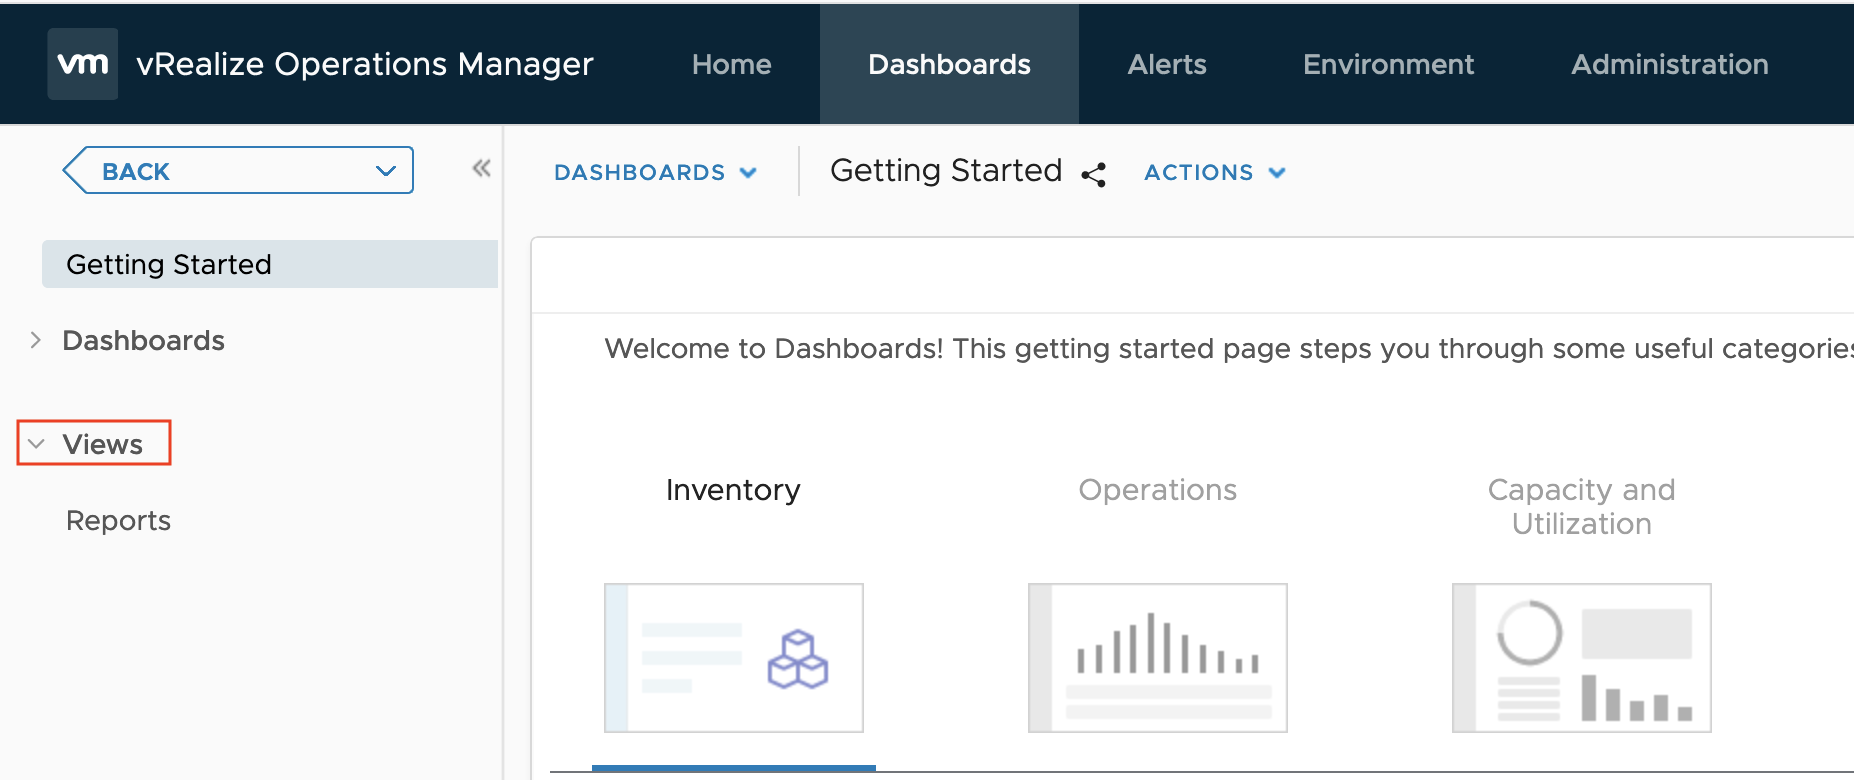 A list of all Views in vRealize Operations will display on the right hand side.
 - Click the Add button.
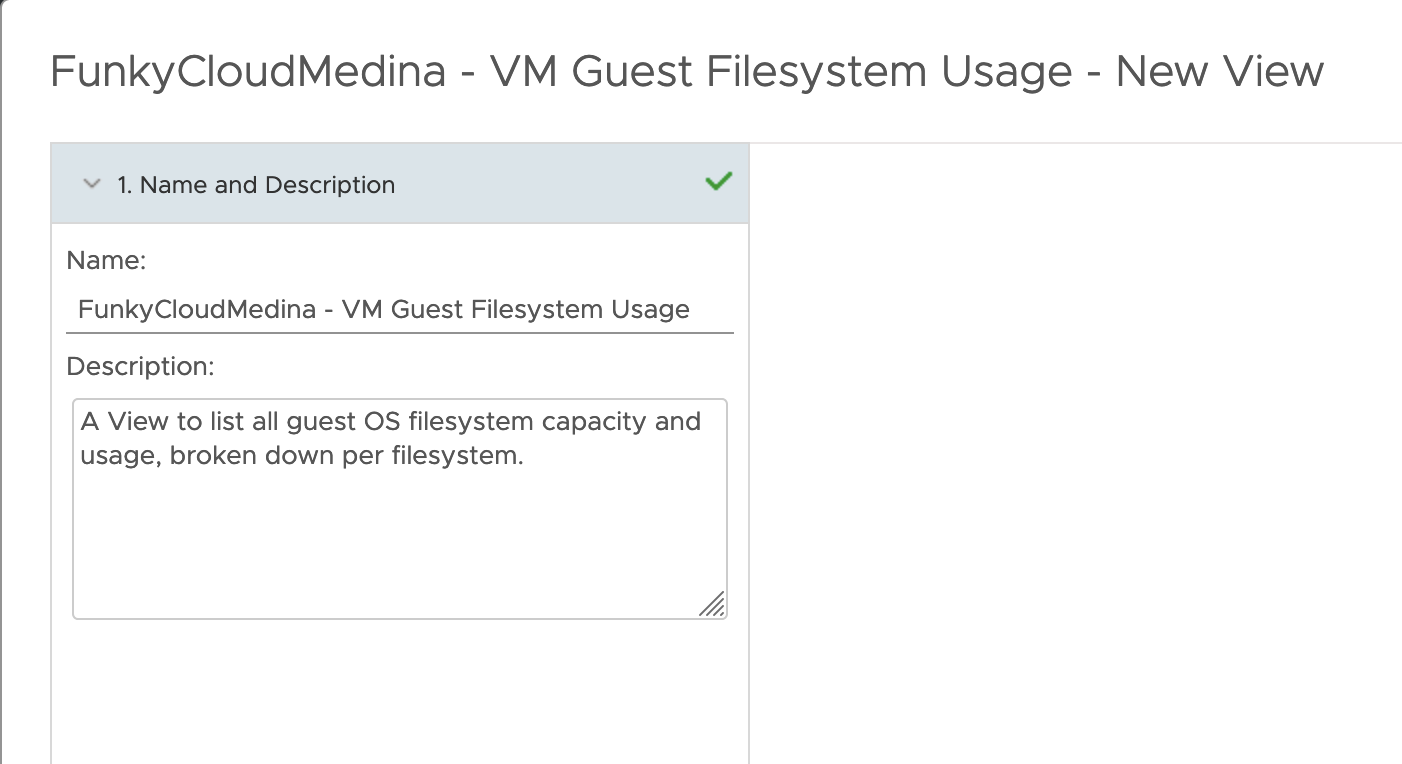
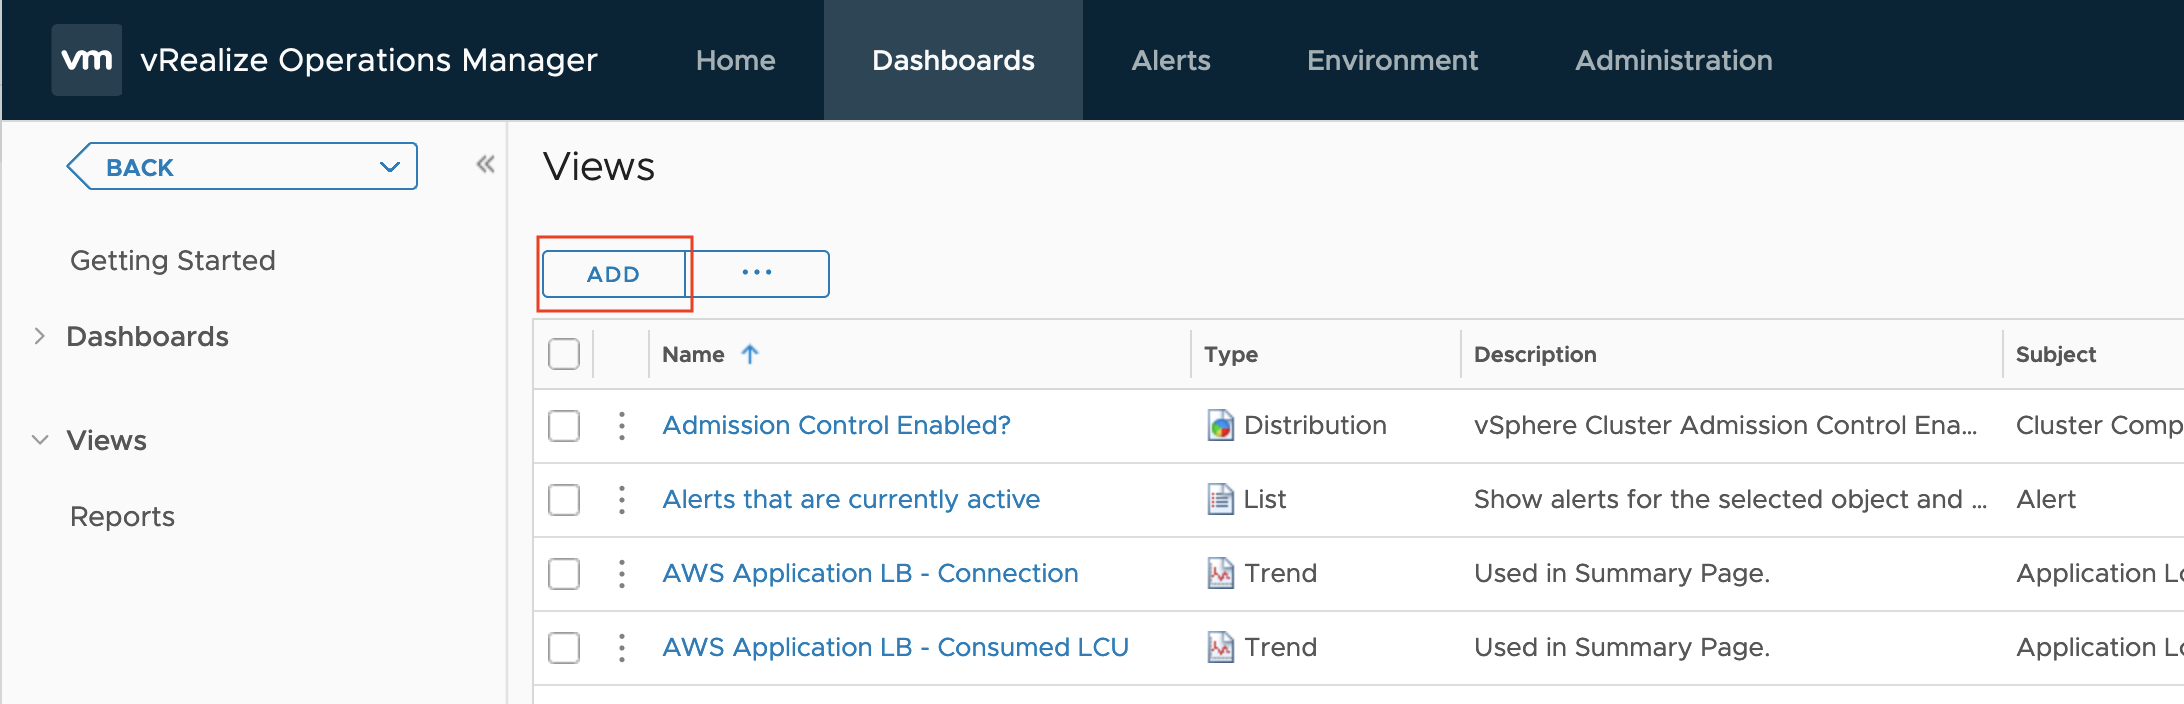 The New View wizard will popup.
 - Enter a Name and Description for the new View.
- Click the Presentation tab at the bottom of the left hand navigation menu.
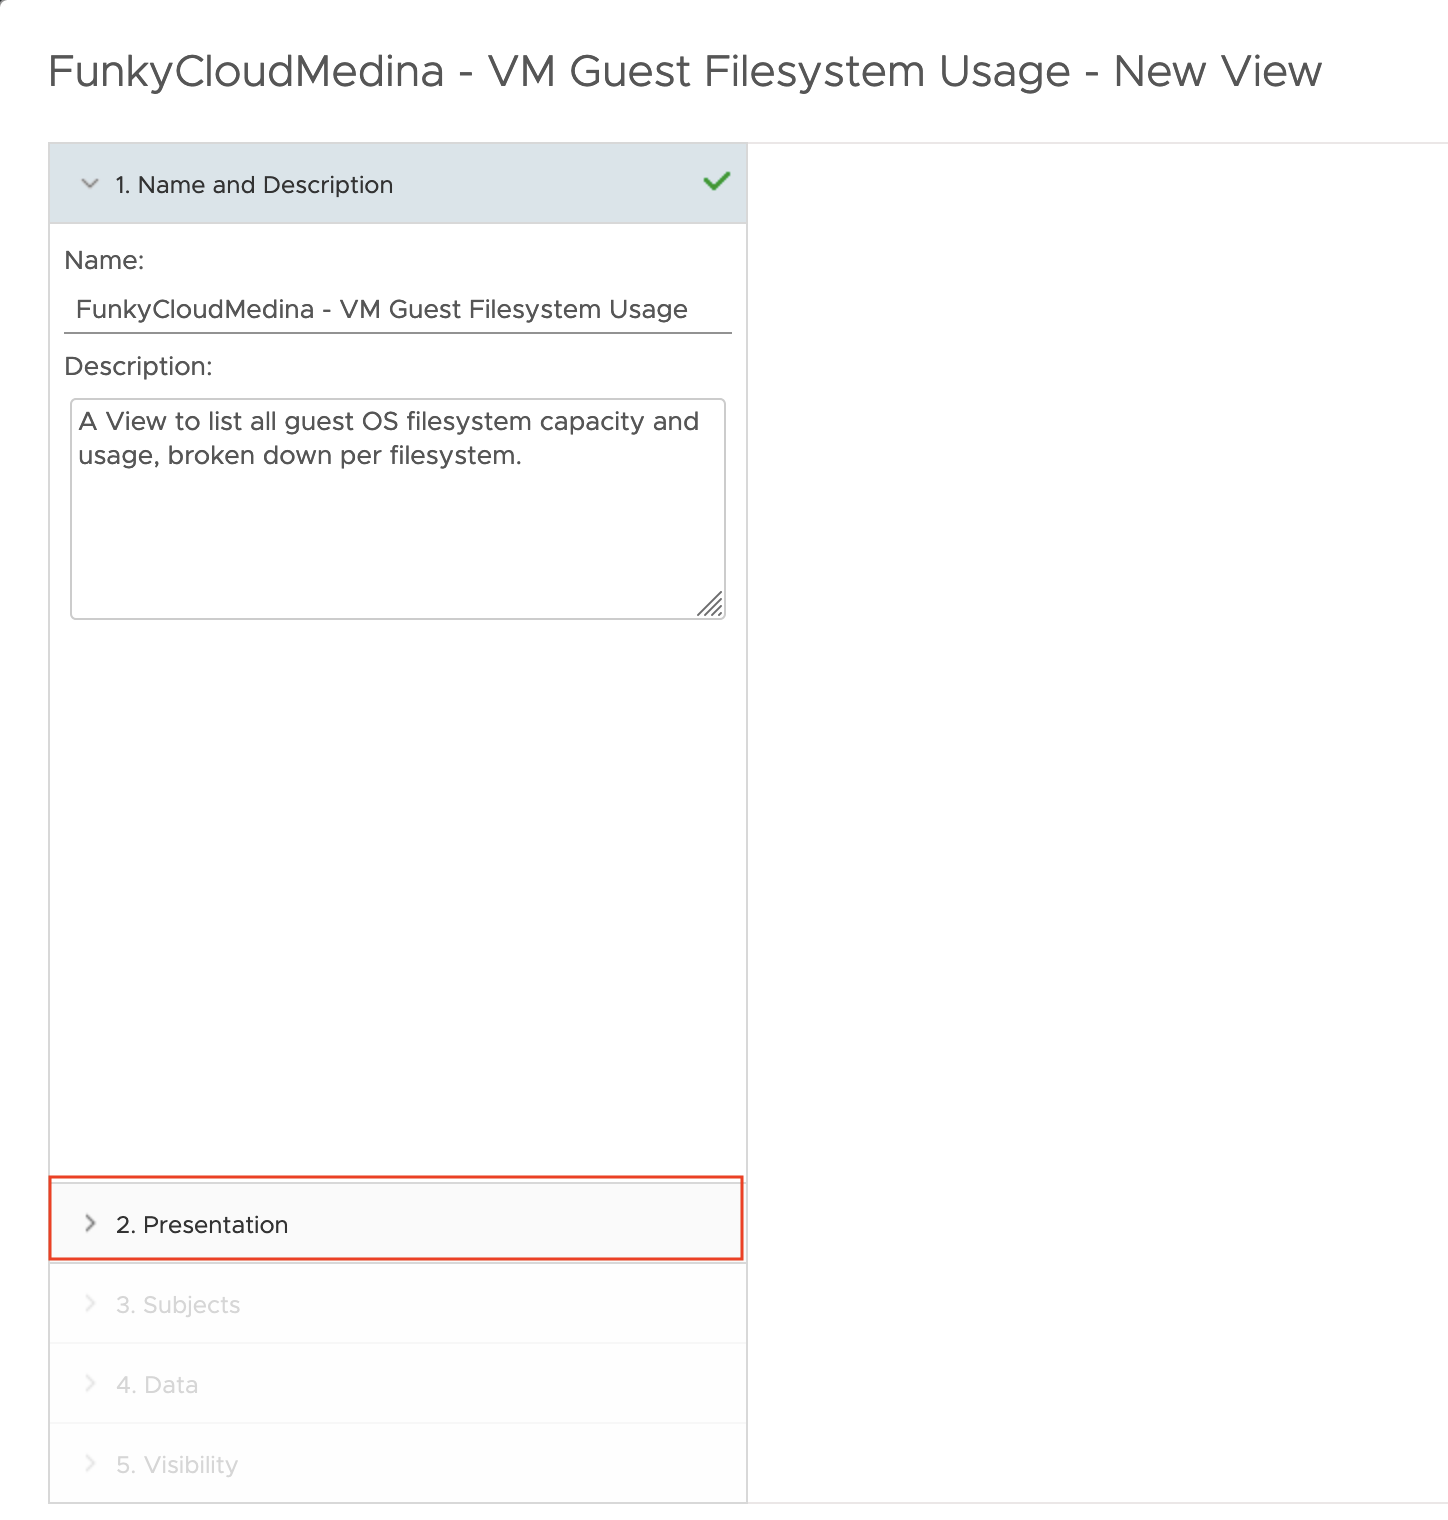
- From the list of Presentation options, select List.
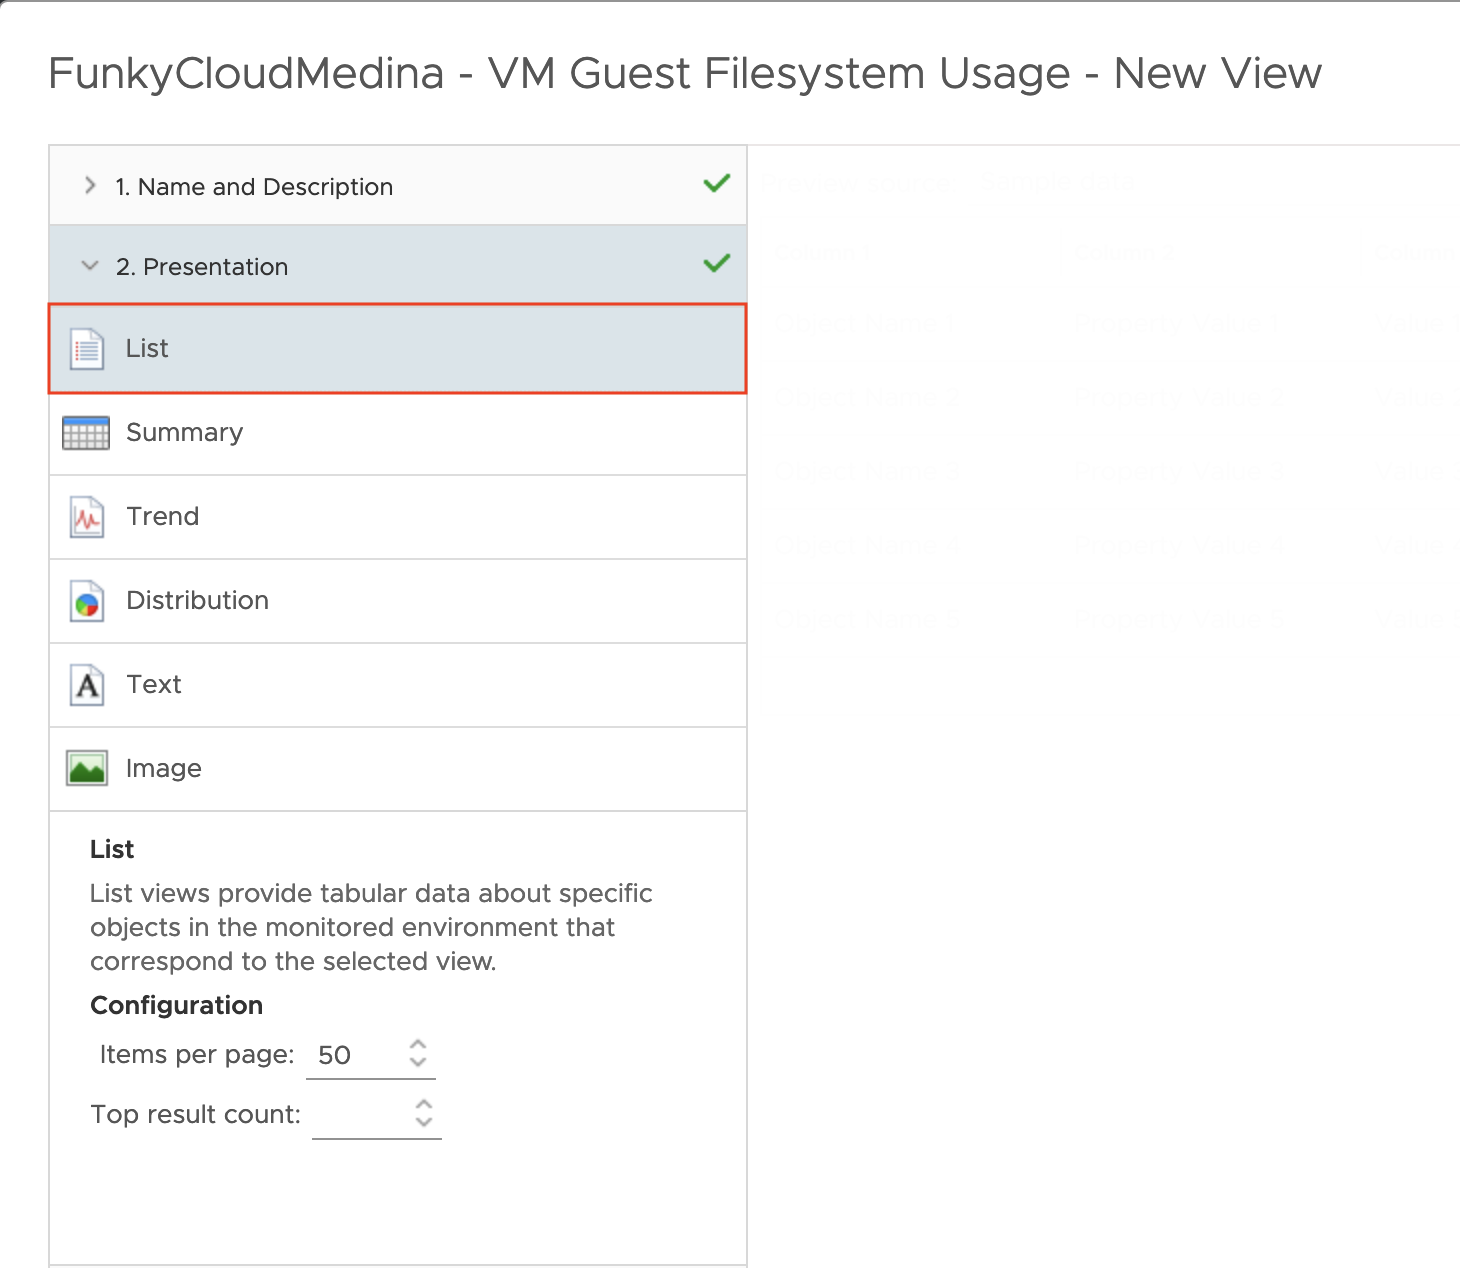 Review the List Configuration and modify the default Items per page option to your liking. I leave it at 50.
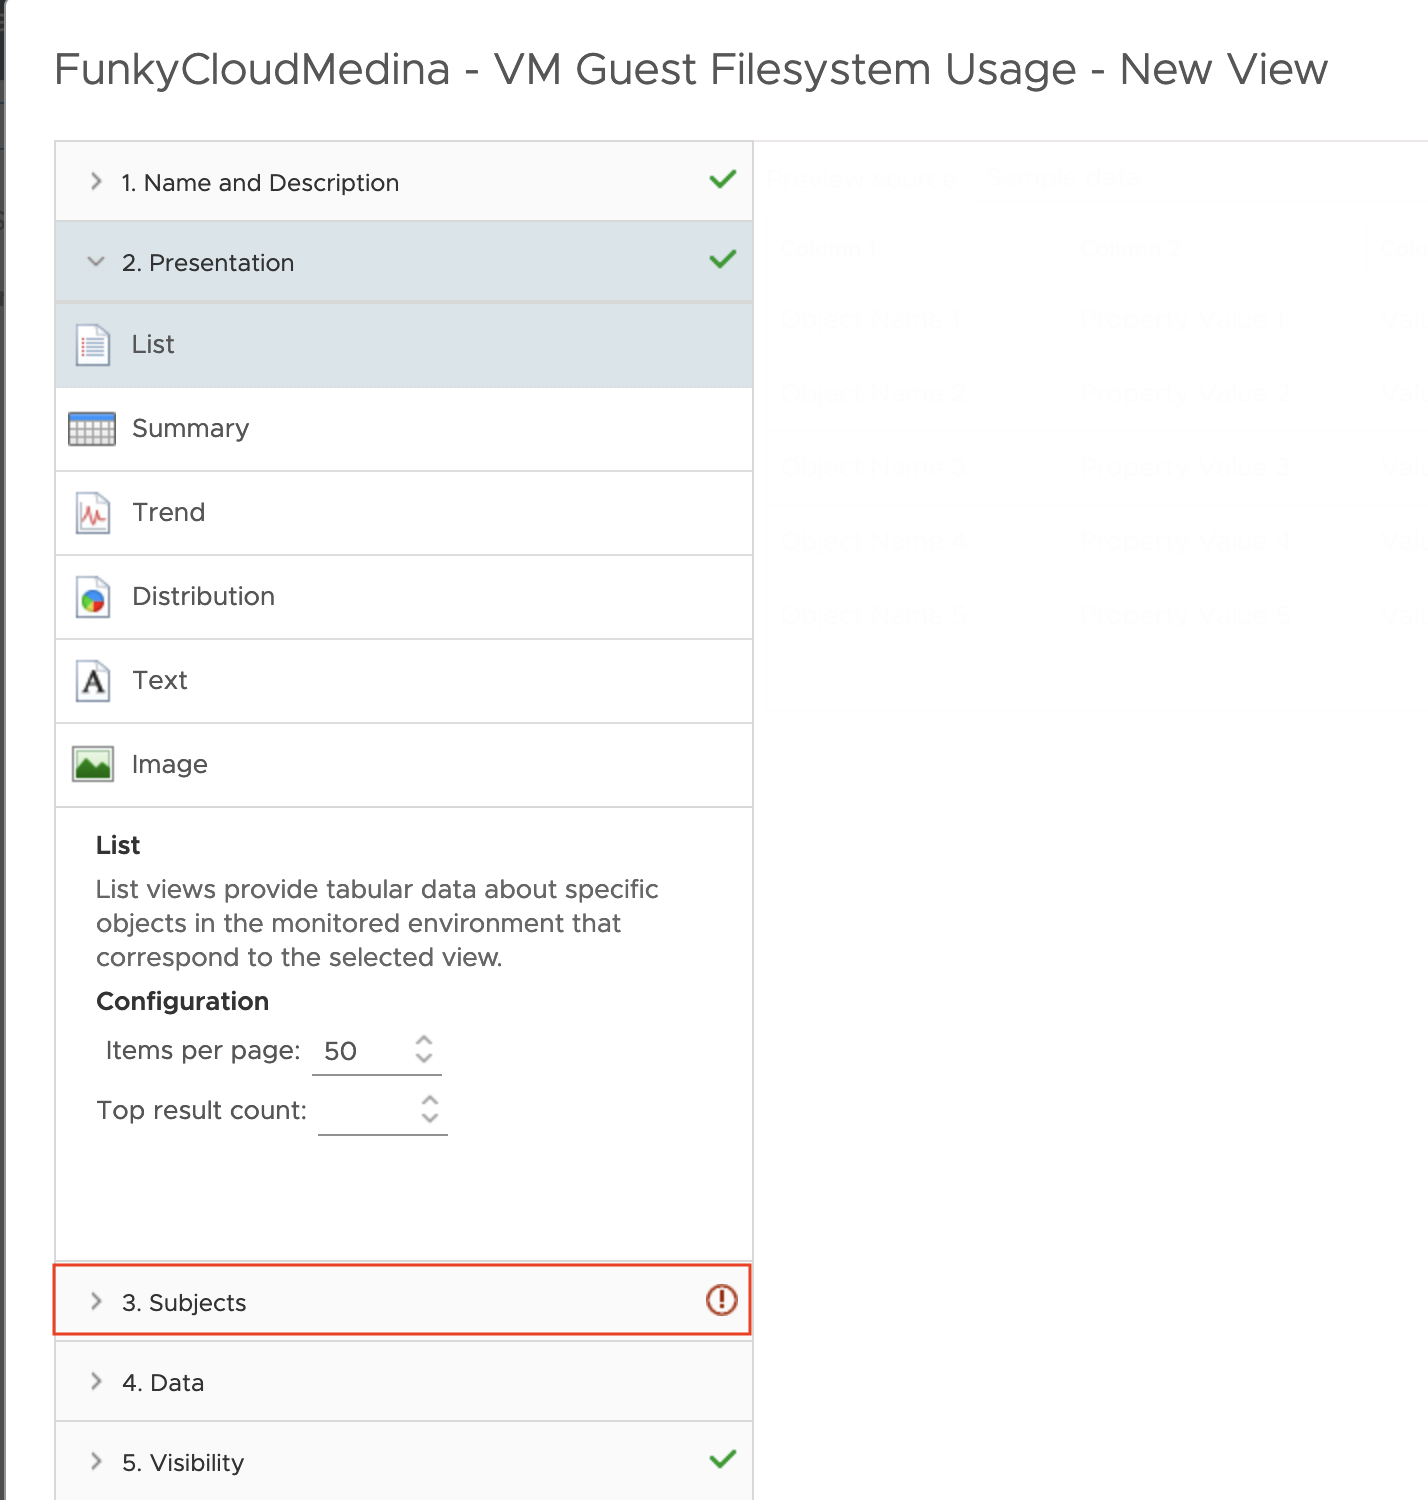
 - Click the Subjects tab at the bottom of the left hand navigation menu.
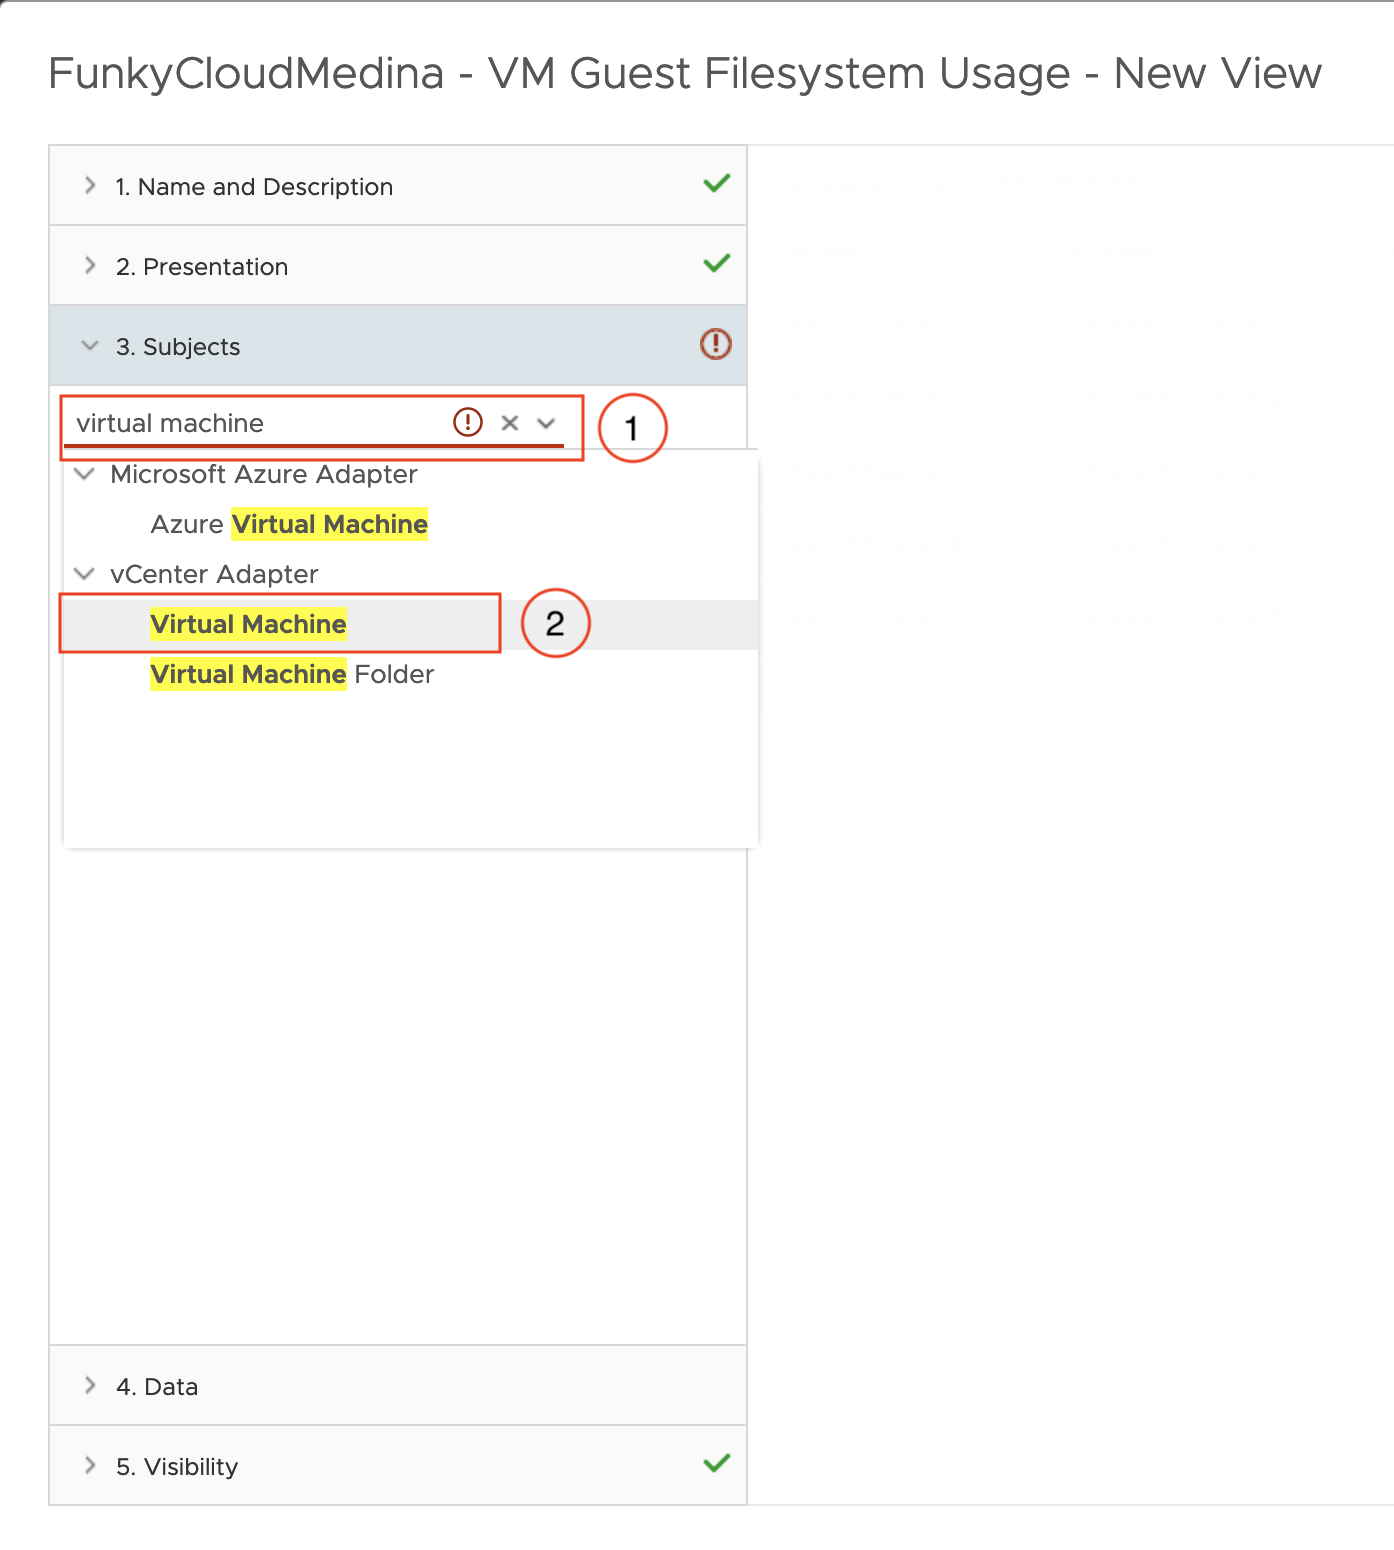
- In the Subject drop down, search for Virtual Machine and select the Virtual Machine object located under vCenter Adapter.
- Click the Data tab at the bottom of the left hand navigation menu.
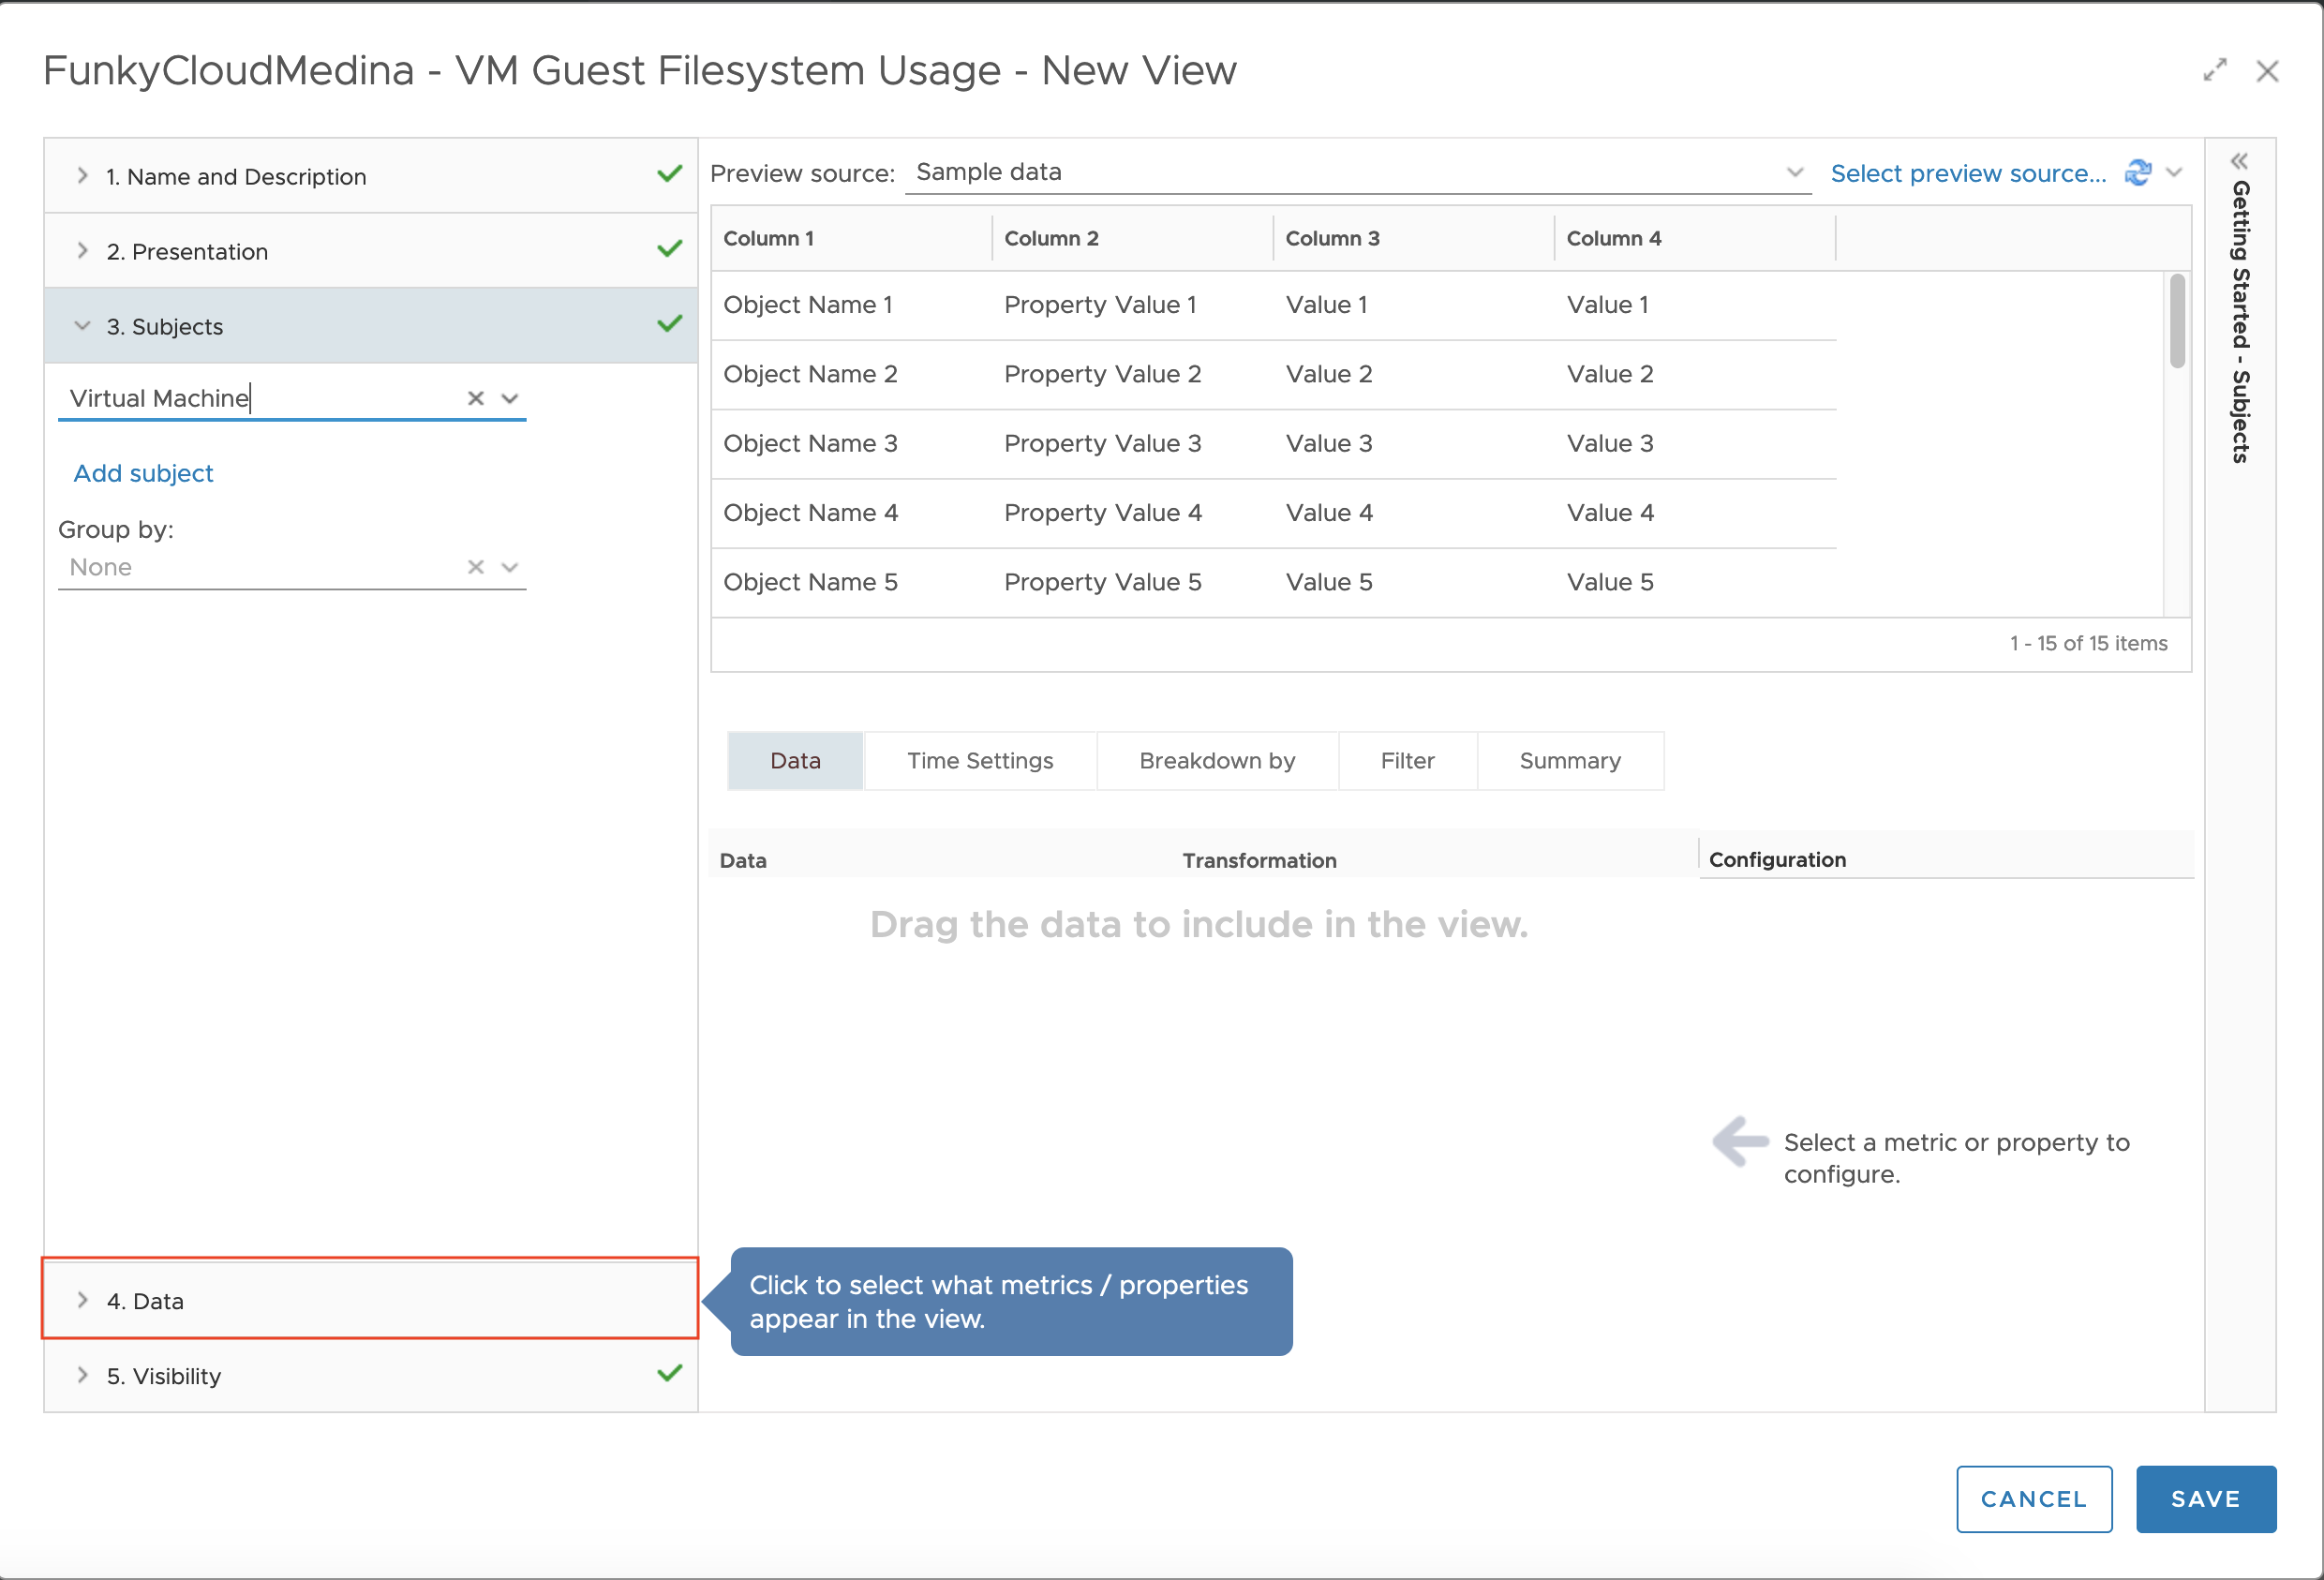 You’ll be shown a list of metrics available for the vCenter Adapter > Virtual Machine object type.
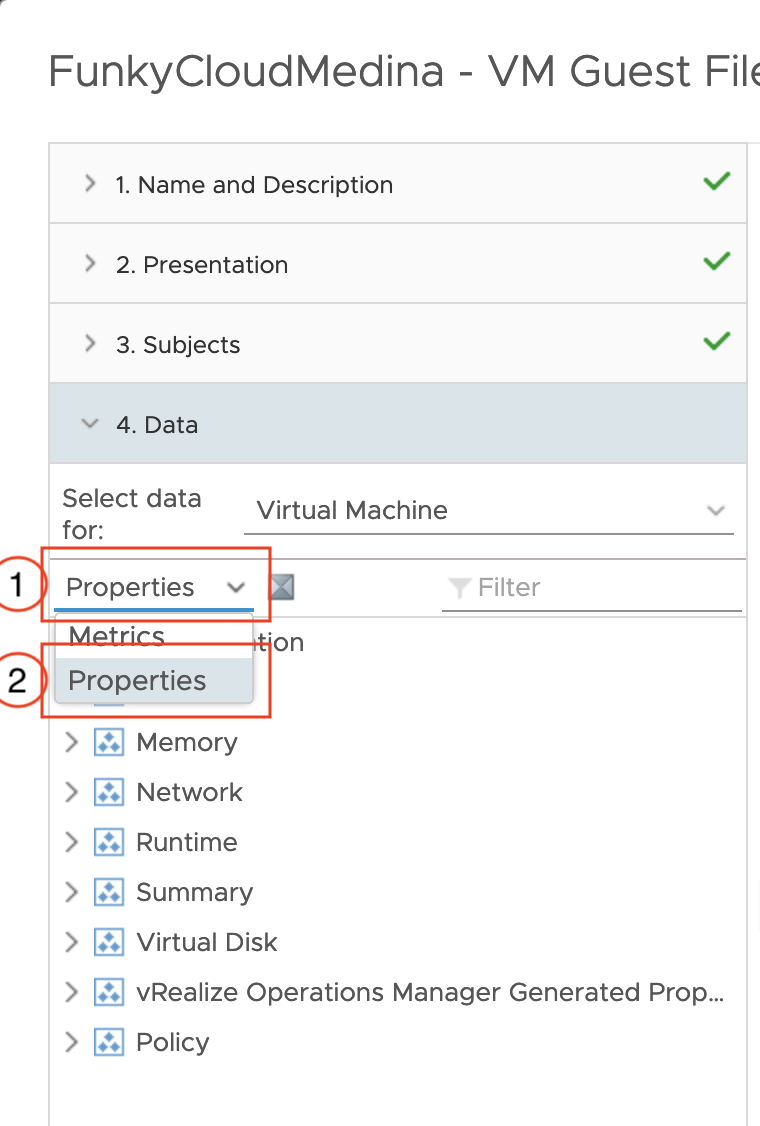
 - Change the Metric Picker from Metrics to Properties.
- In the Metric Picker, expand Configuration > Hardware. Double click Number of virtual CPUs and double click Memory (KB).
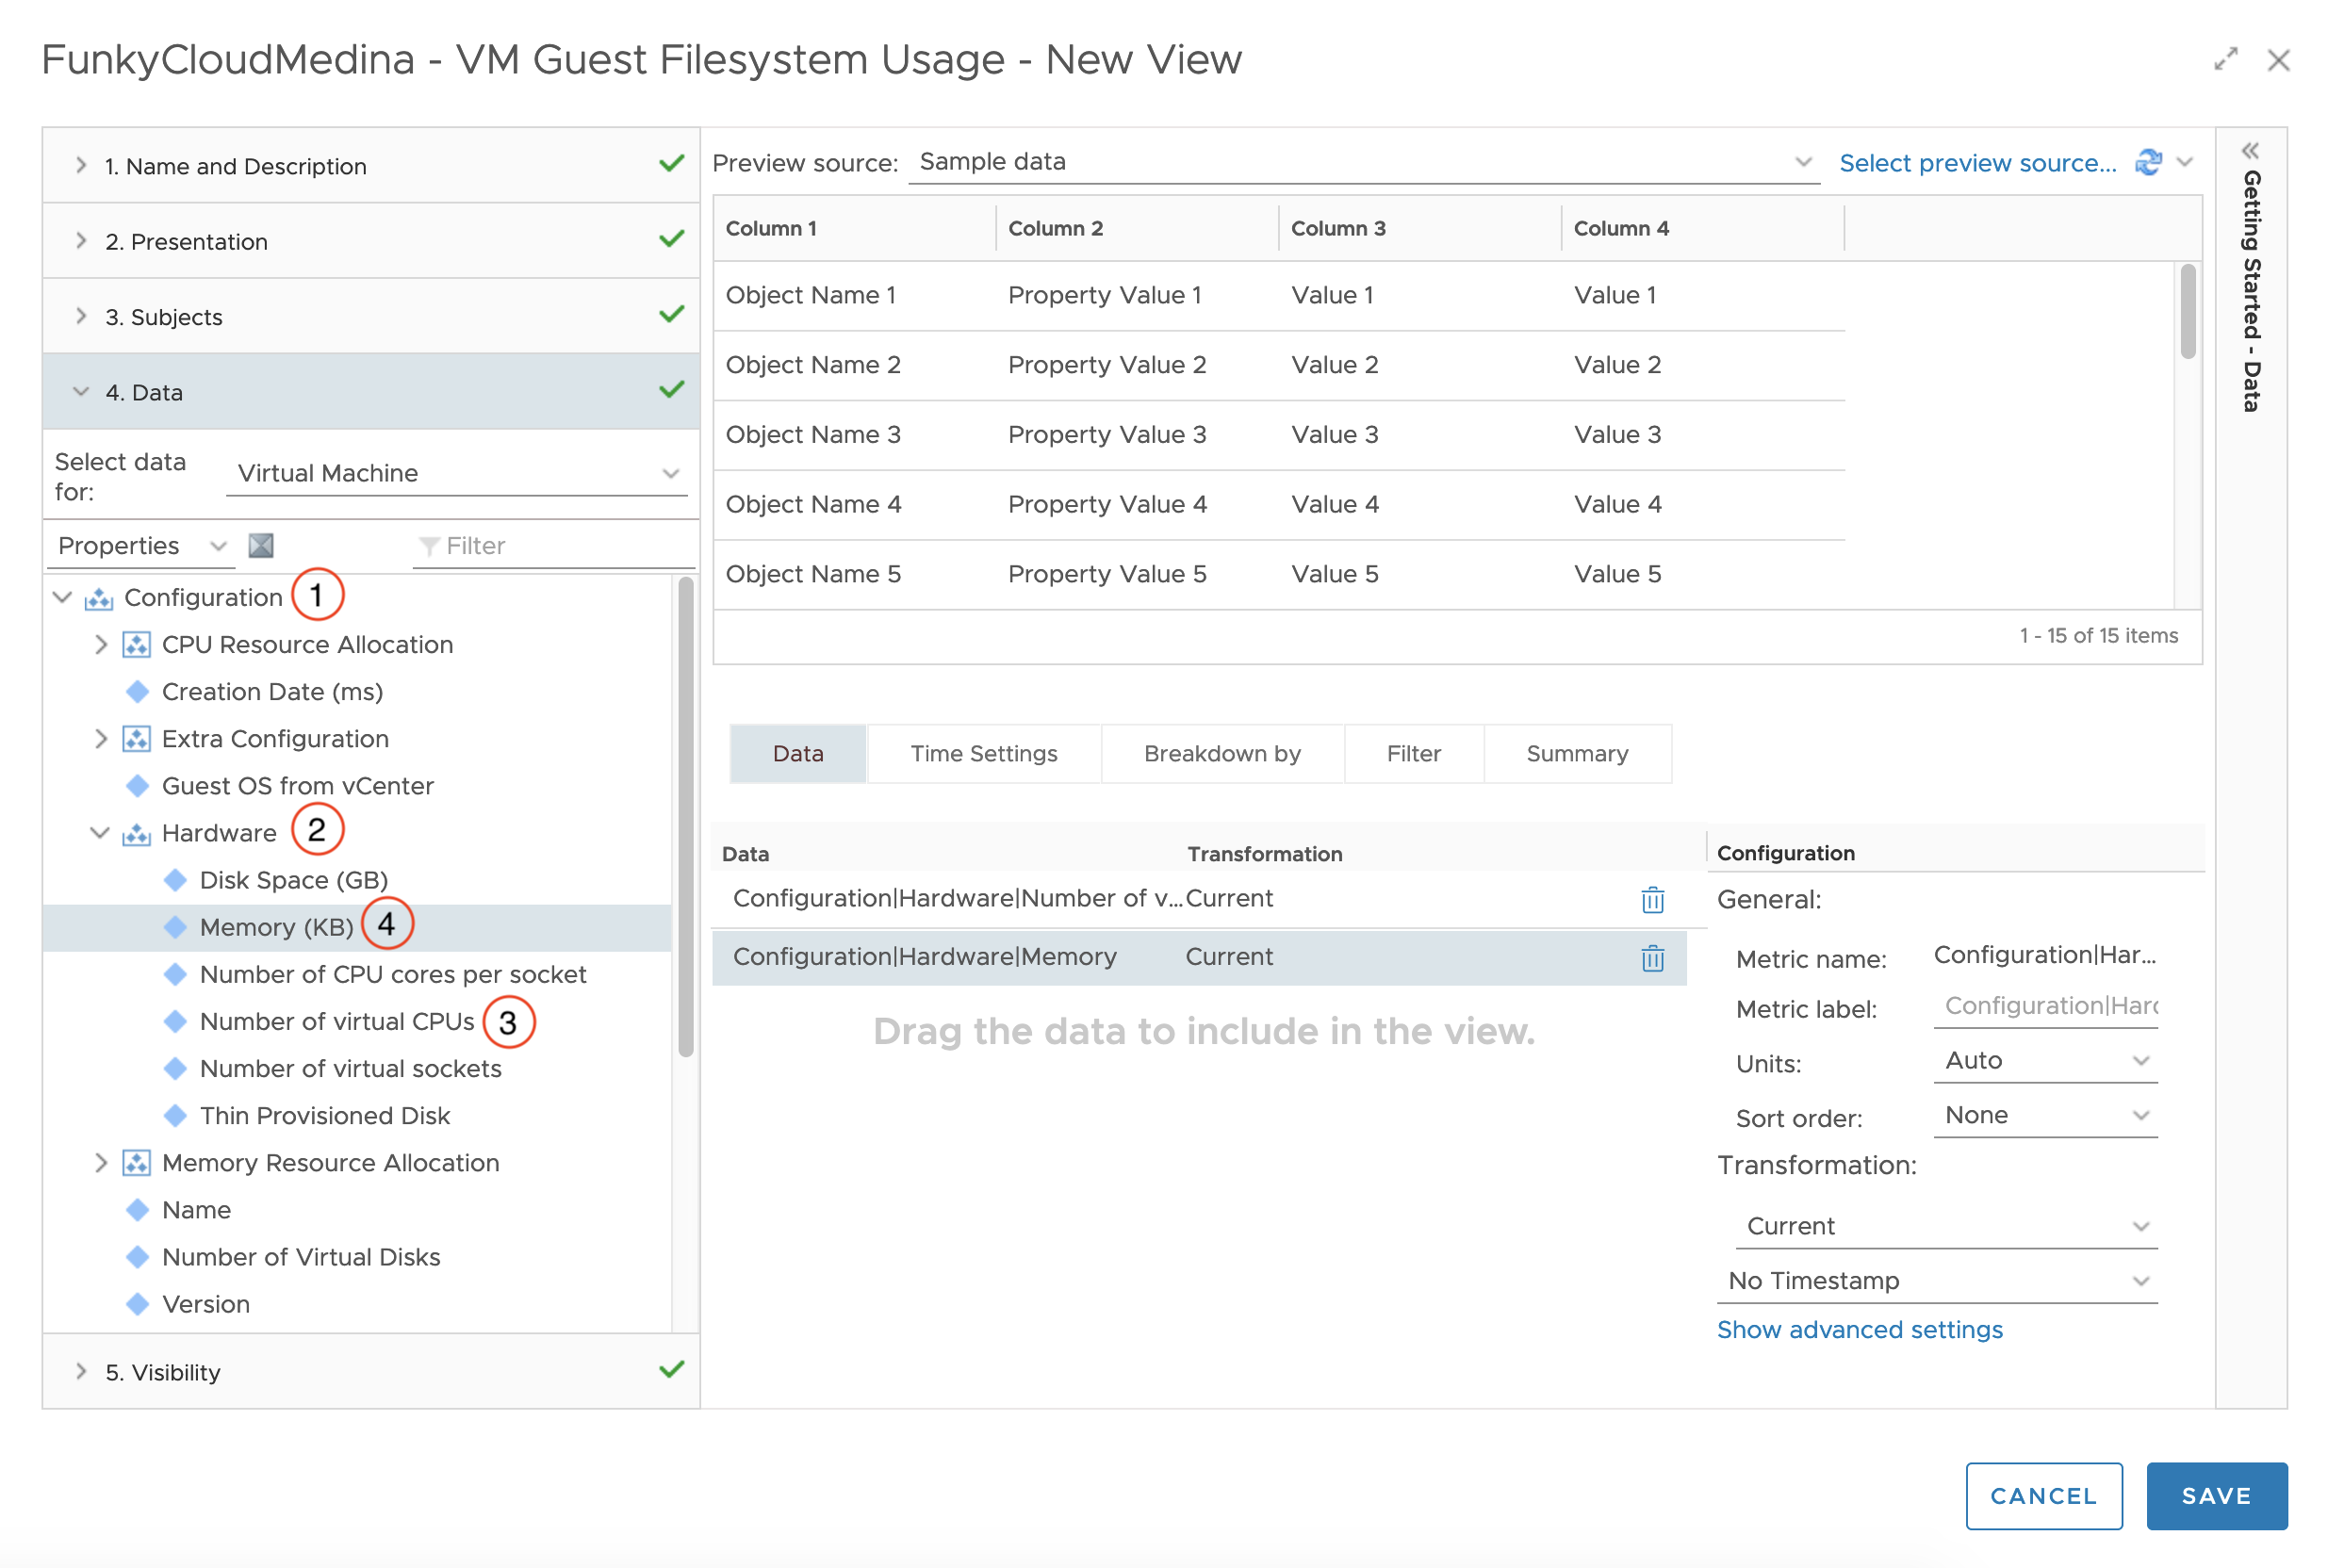 The 2 Properties appear in the “working area” on the right hand side for your View.
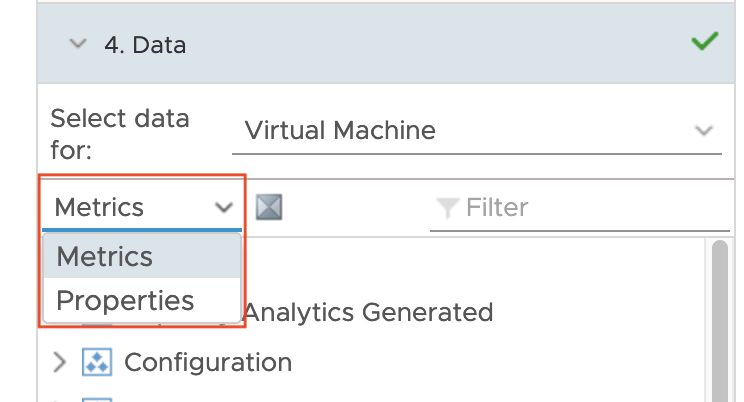
 - Change the Metric Picker back to Metrics.
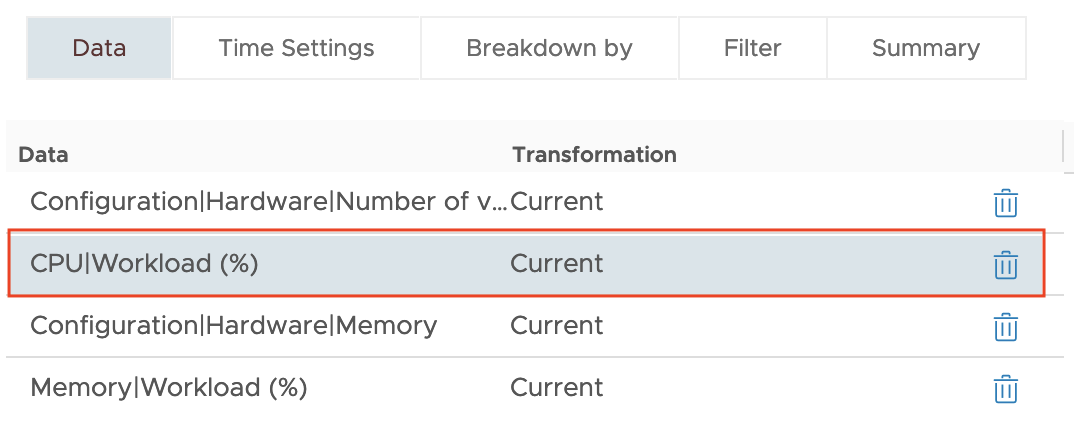
- Expand CPU and double click Workload (%). Expand Memory and double click Workload (%).
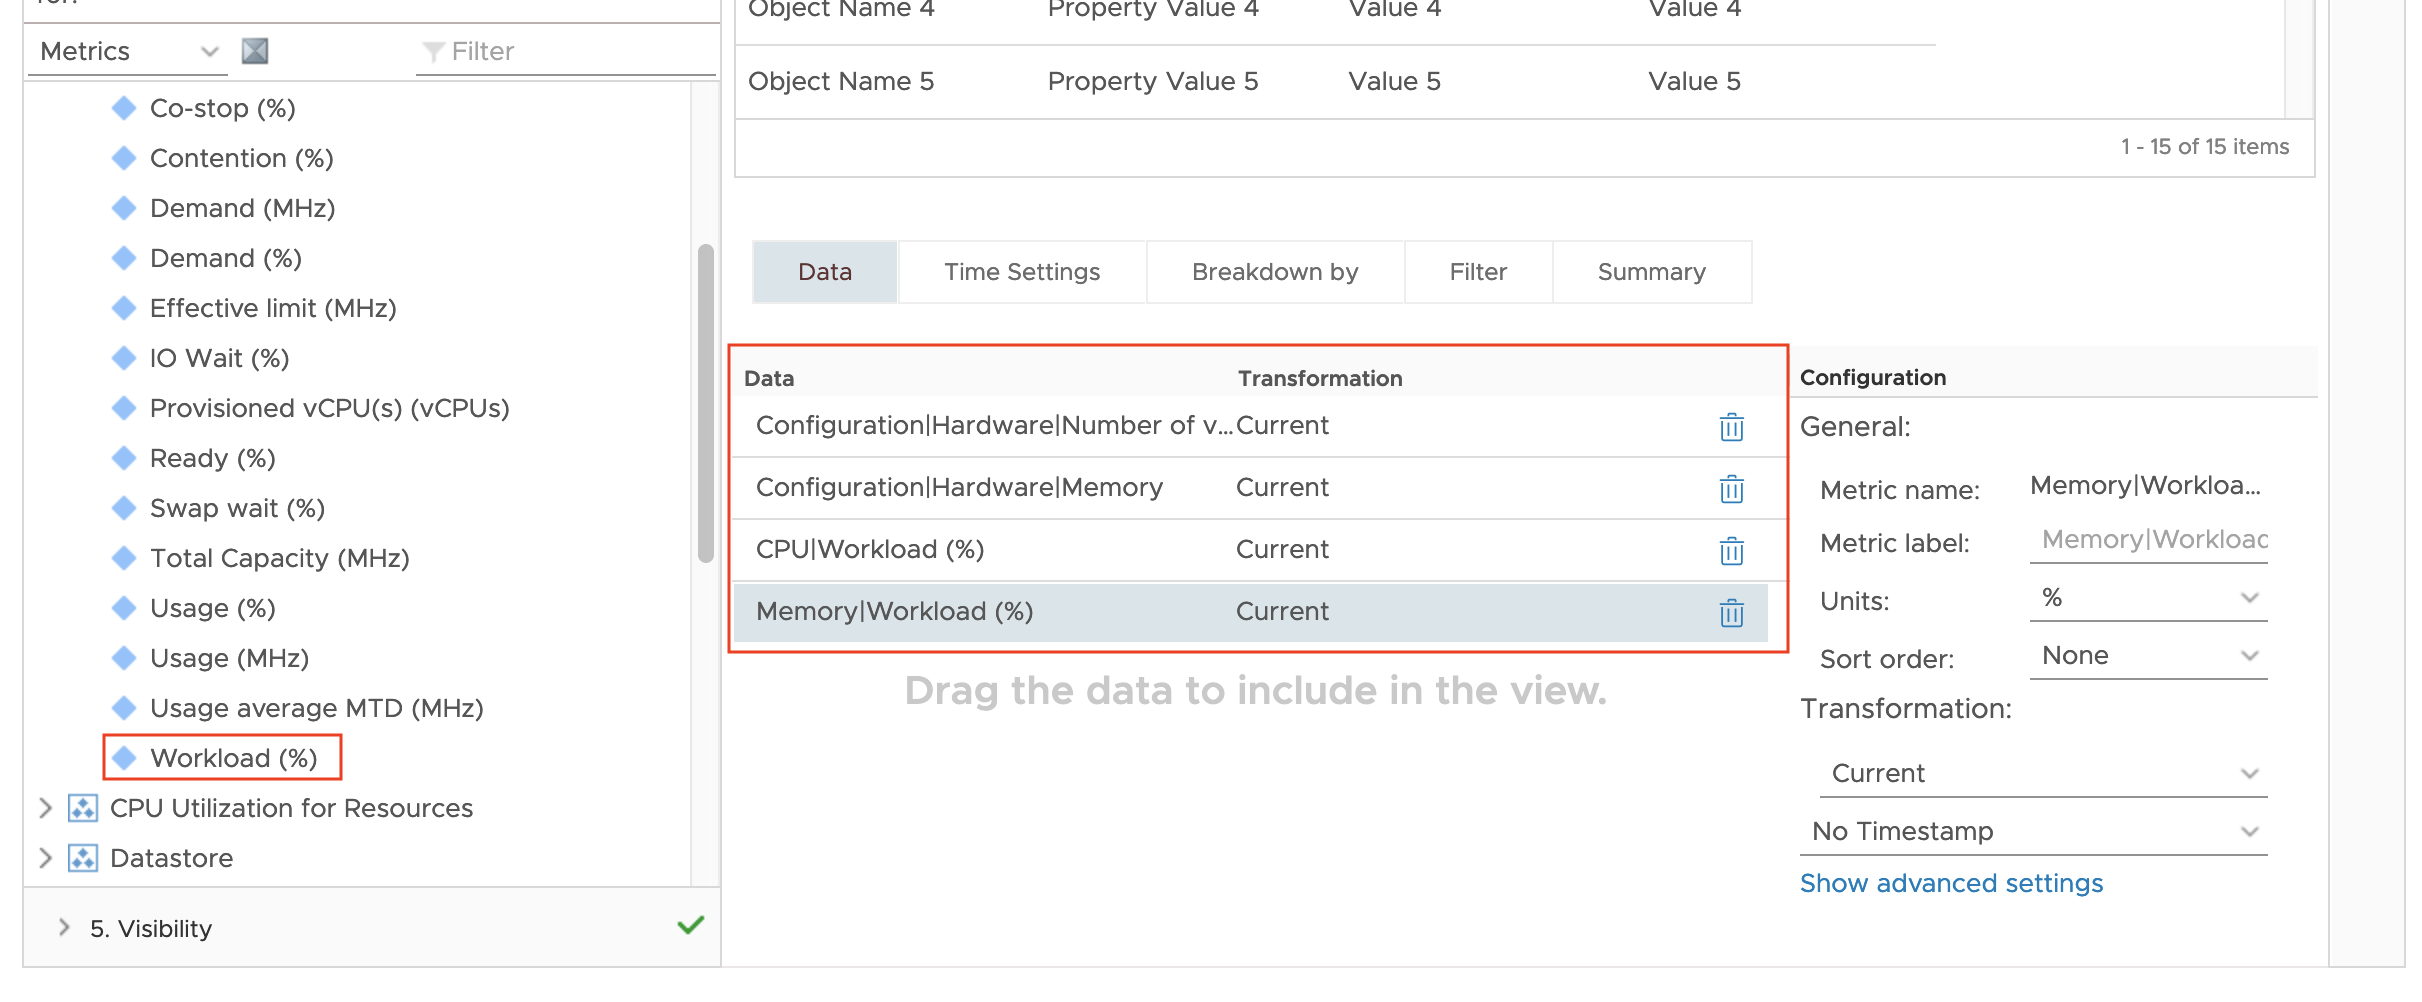
- In the center Data “working area”, drag and drop the CPU Workload (%) up one row, below Number of virtual CPUs.
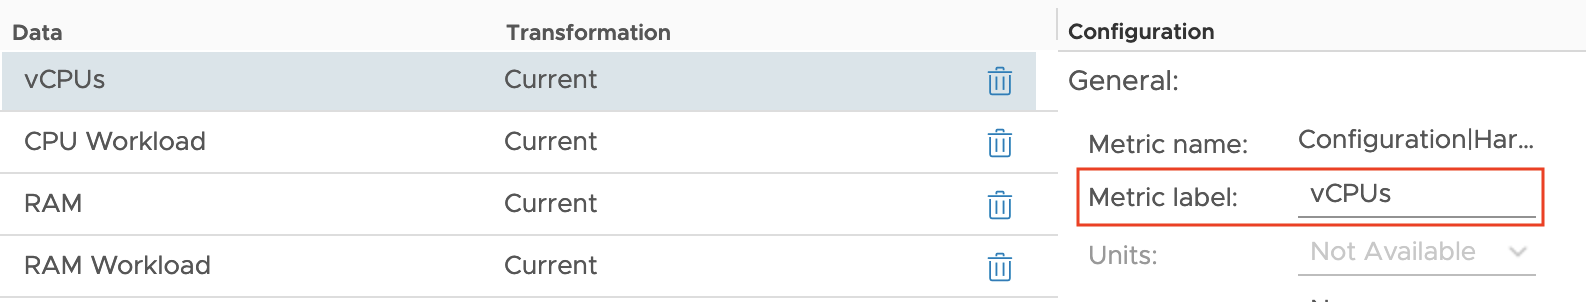
- For each metric/property, one at a time, and use the Metric Label field to the right to rename the metric in the view.
- We will now add the filesystem fields. In the Metric Picker, browse for and expand Guest File System. Expand any of the guest filesystems.
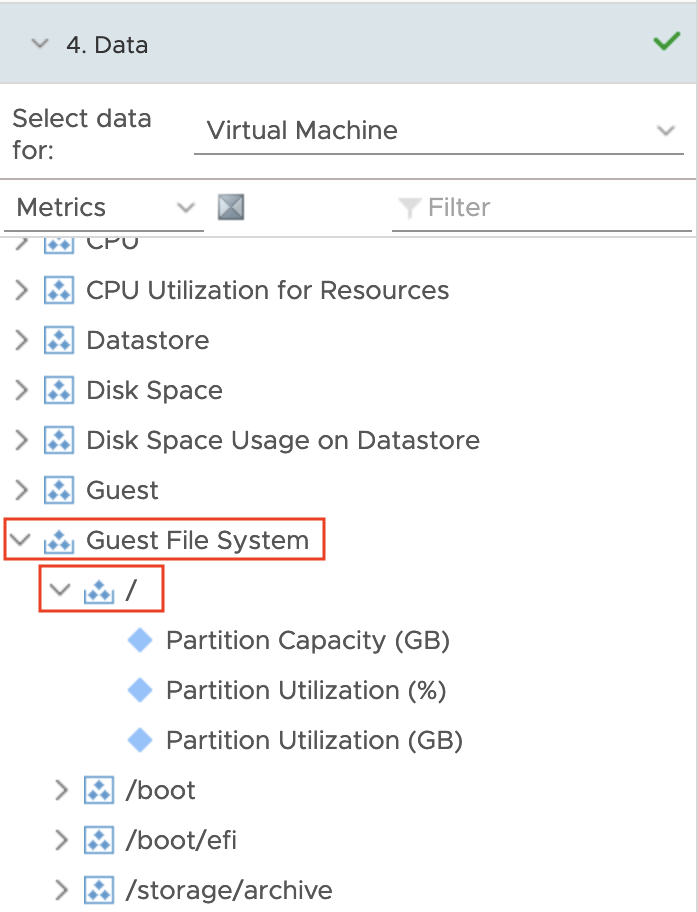
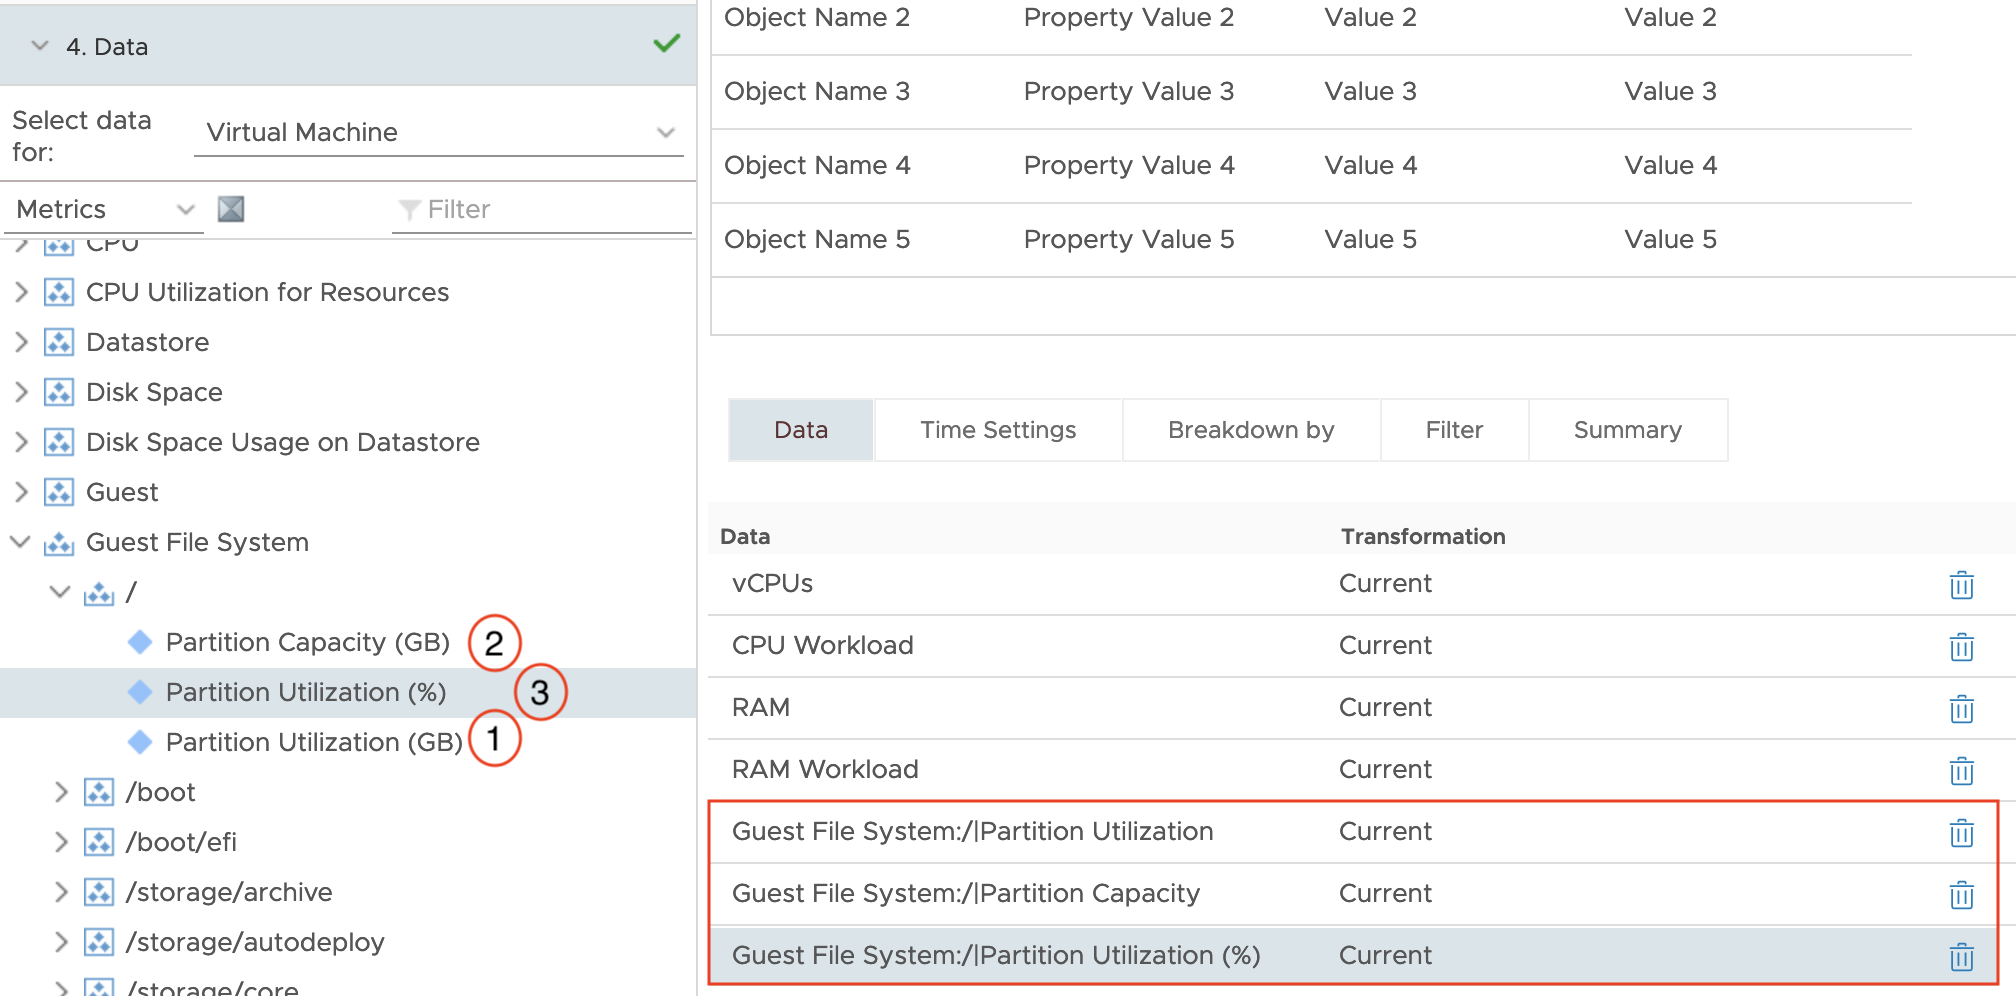
- Double click Partition Utilization (GB), Partition Capacity (GB), and Partition Utilization (%).
- Click the Breakdown By tab and select Add instance breakdown column (see data for column settings).
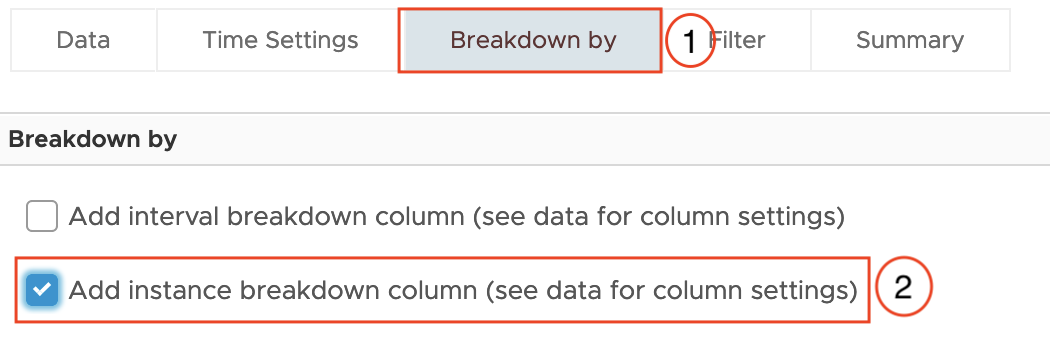
- Switch back to the Data tab. There is a new metric called Instance Name. Drag it below RAM Workload.
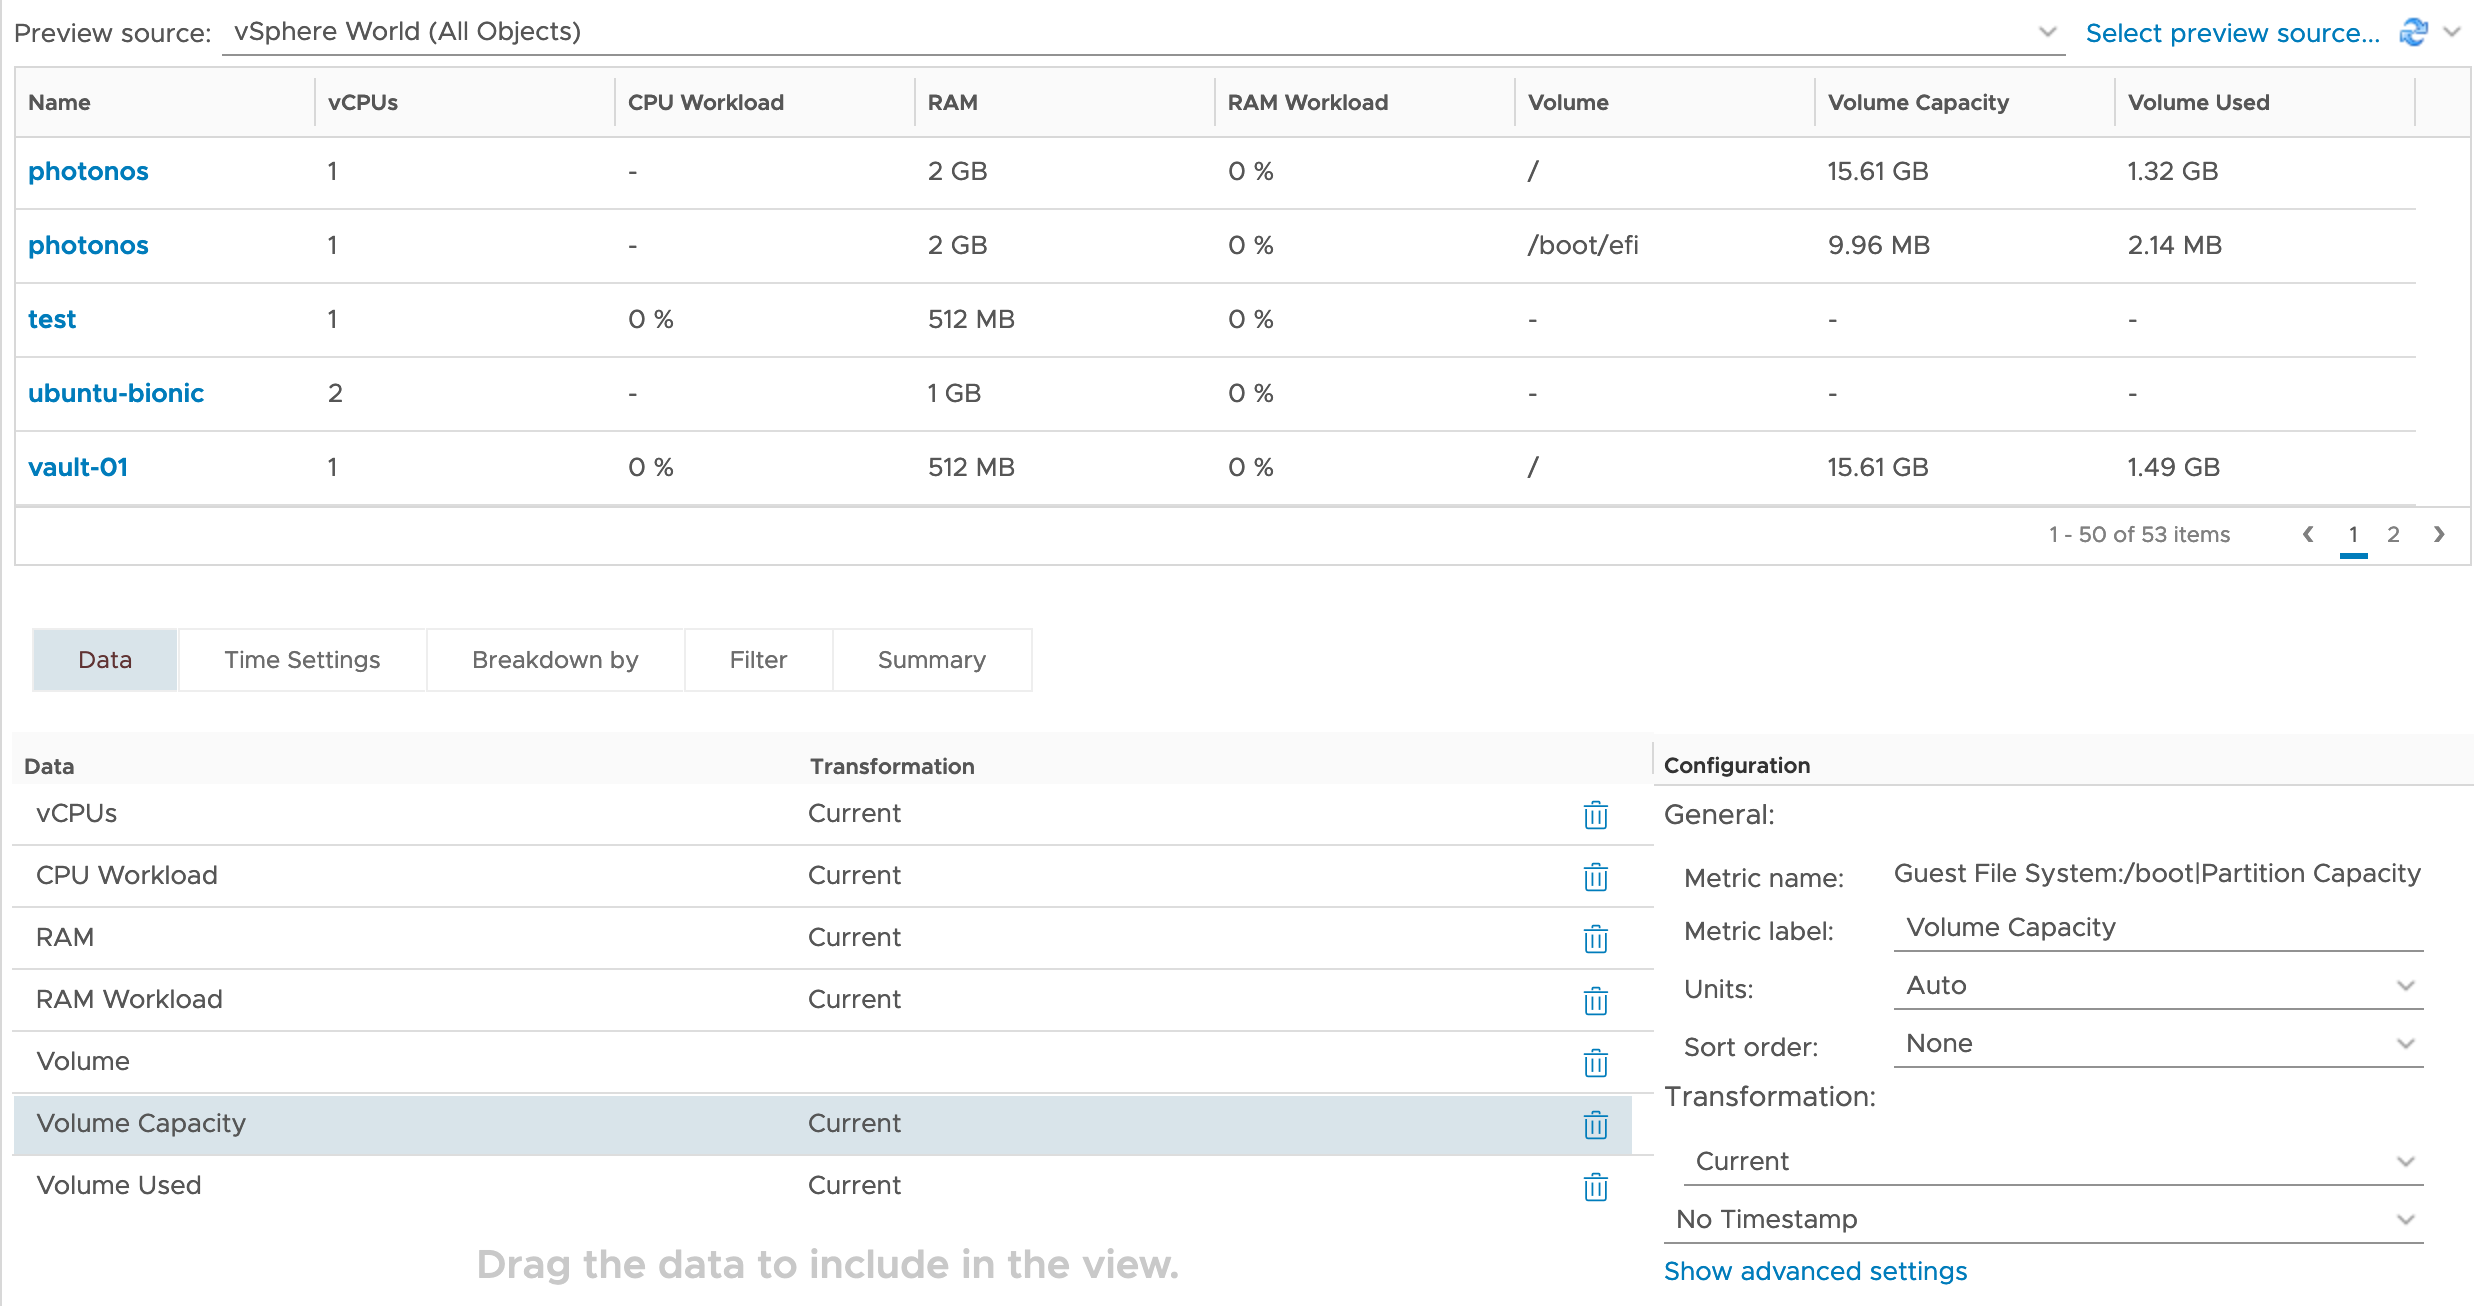
- With Instance Name still selected, use the configuration box on the right to set the Label to Filesystem, and the Metric Group to Guest File System.

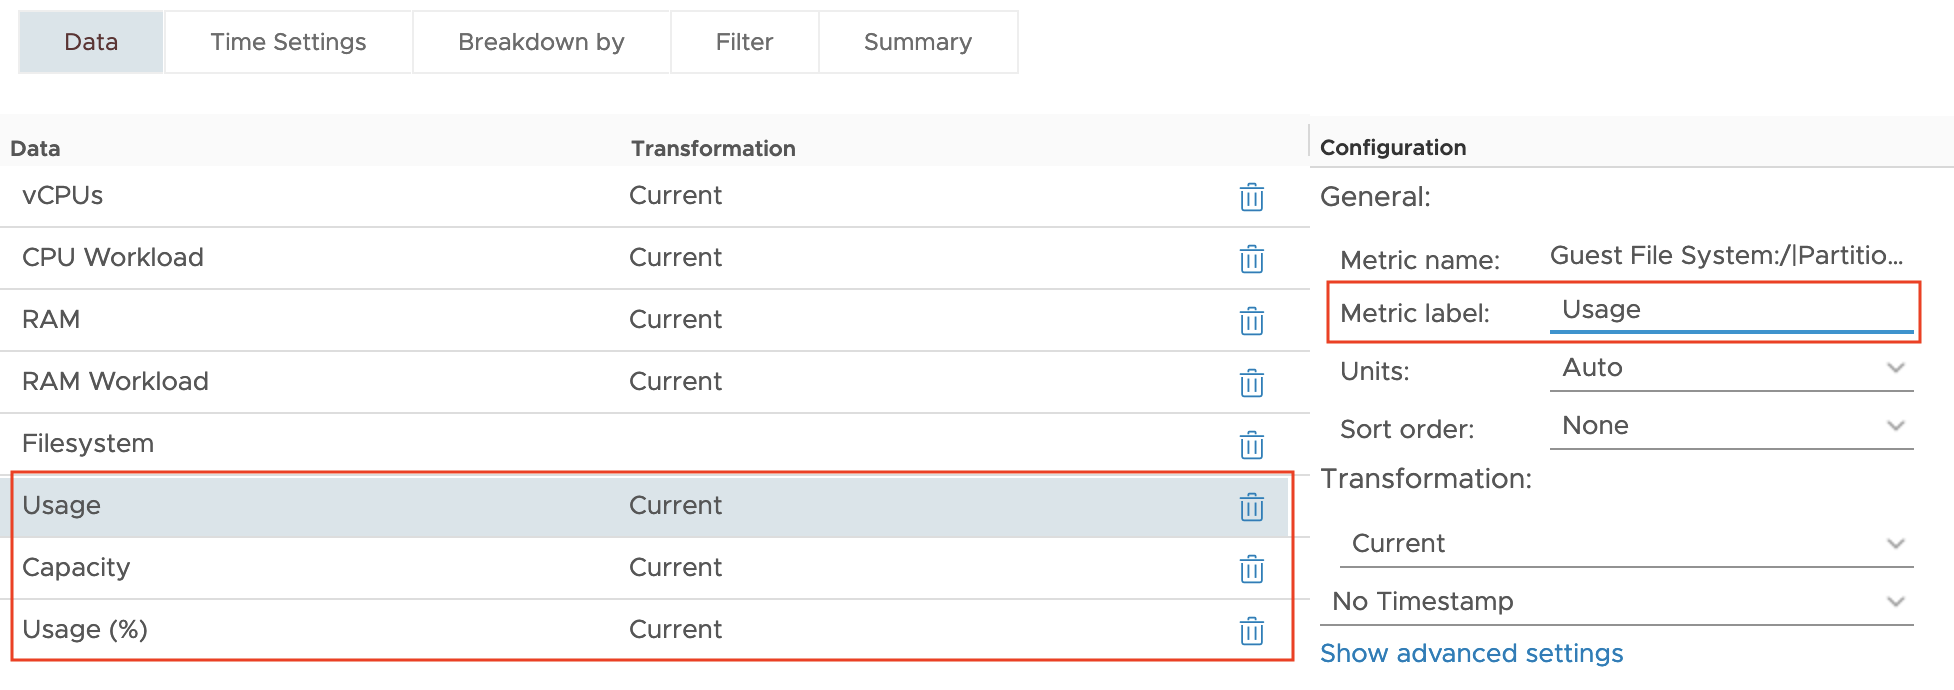
- As with step 16, select each Guest Filesystem metric and rename them to Usage, Capacity and Usage (%) respectively.
- Click the Save button.
Creating the Report
- Log in to your vRealize Operations instance.
- Click Dashboards at the top of the page.
- Click Reports on the left hand side.
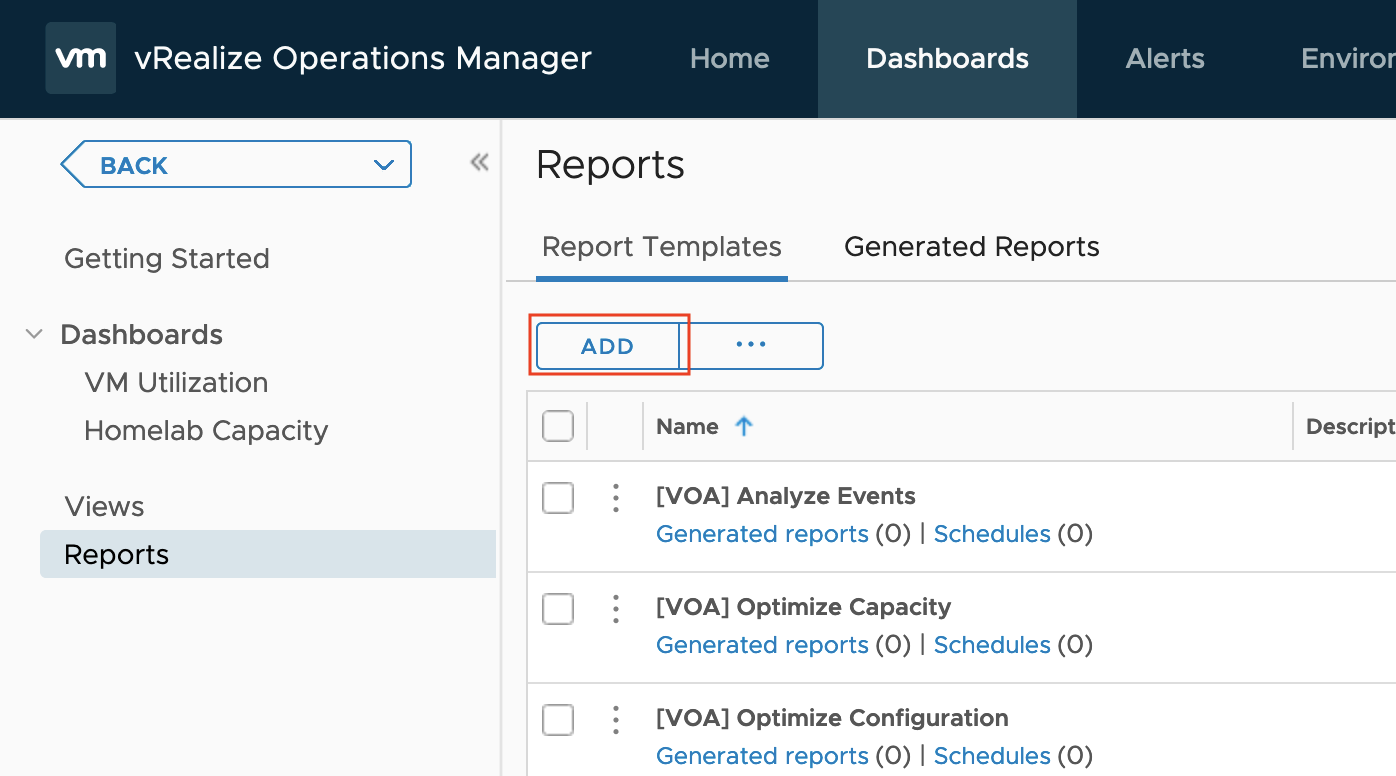
- Click the Add button
 The New Template wizard will open.
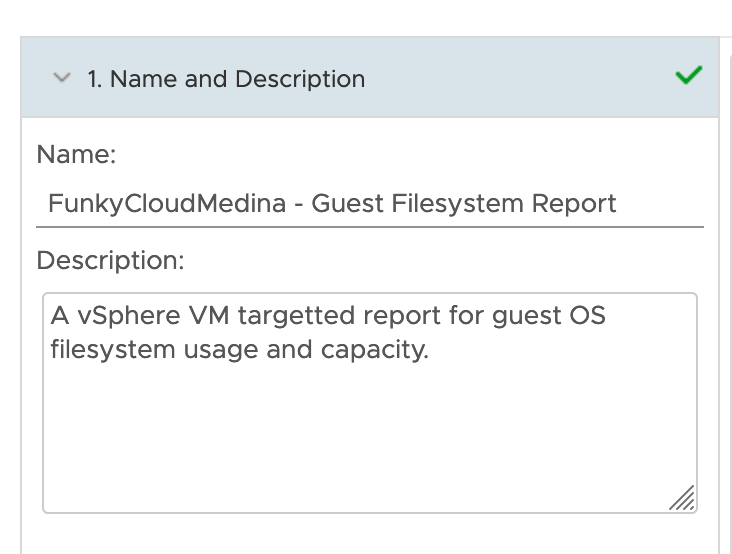
 - Provide a Name and Description for your new report.
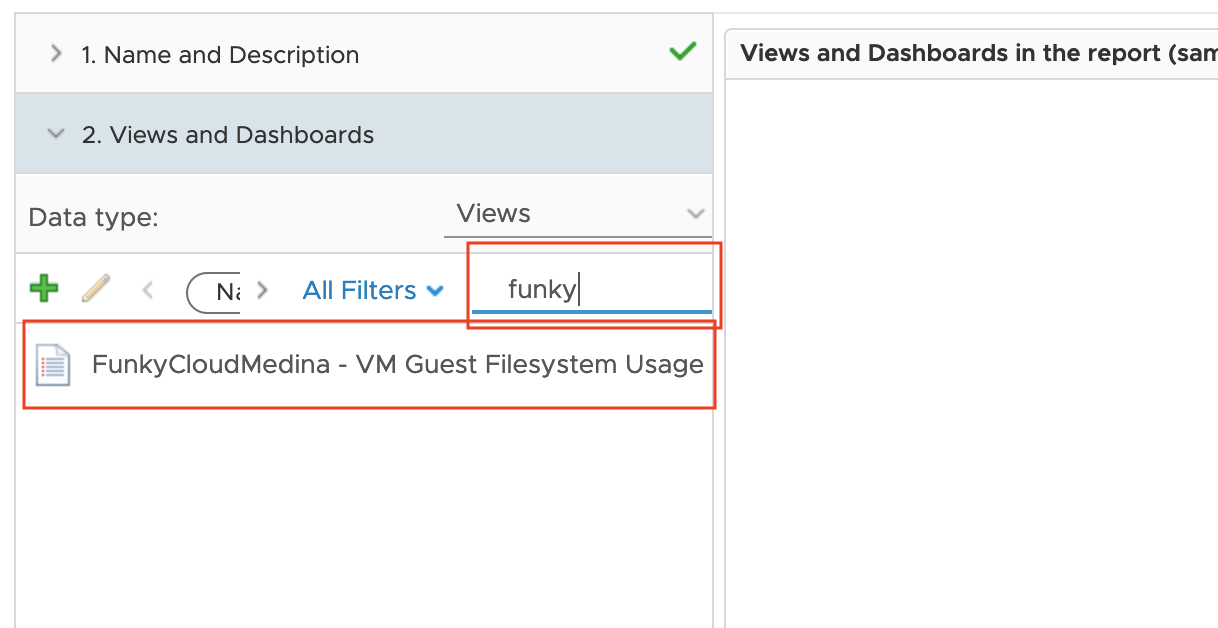
- Click the Views and Dashboards tab at the bottom of the left-hand menu.
- Use the Views search box to find the View you created earlier.
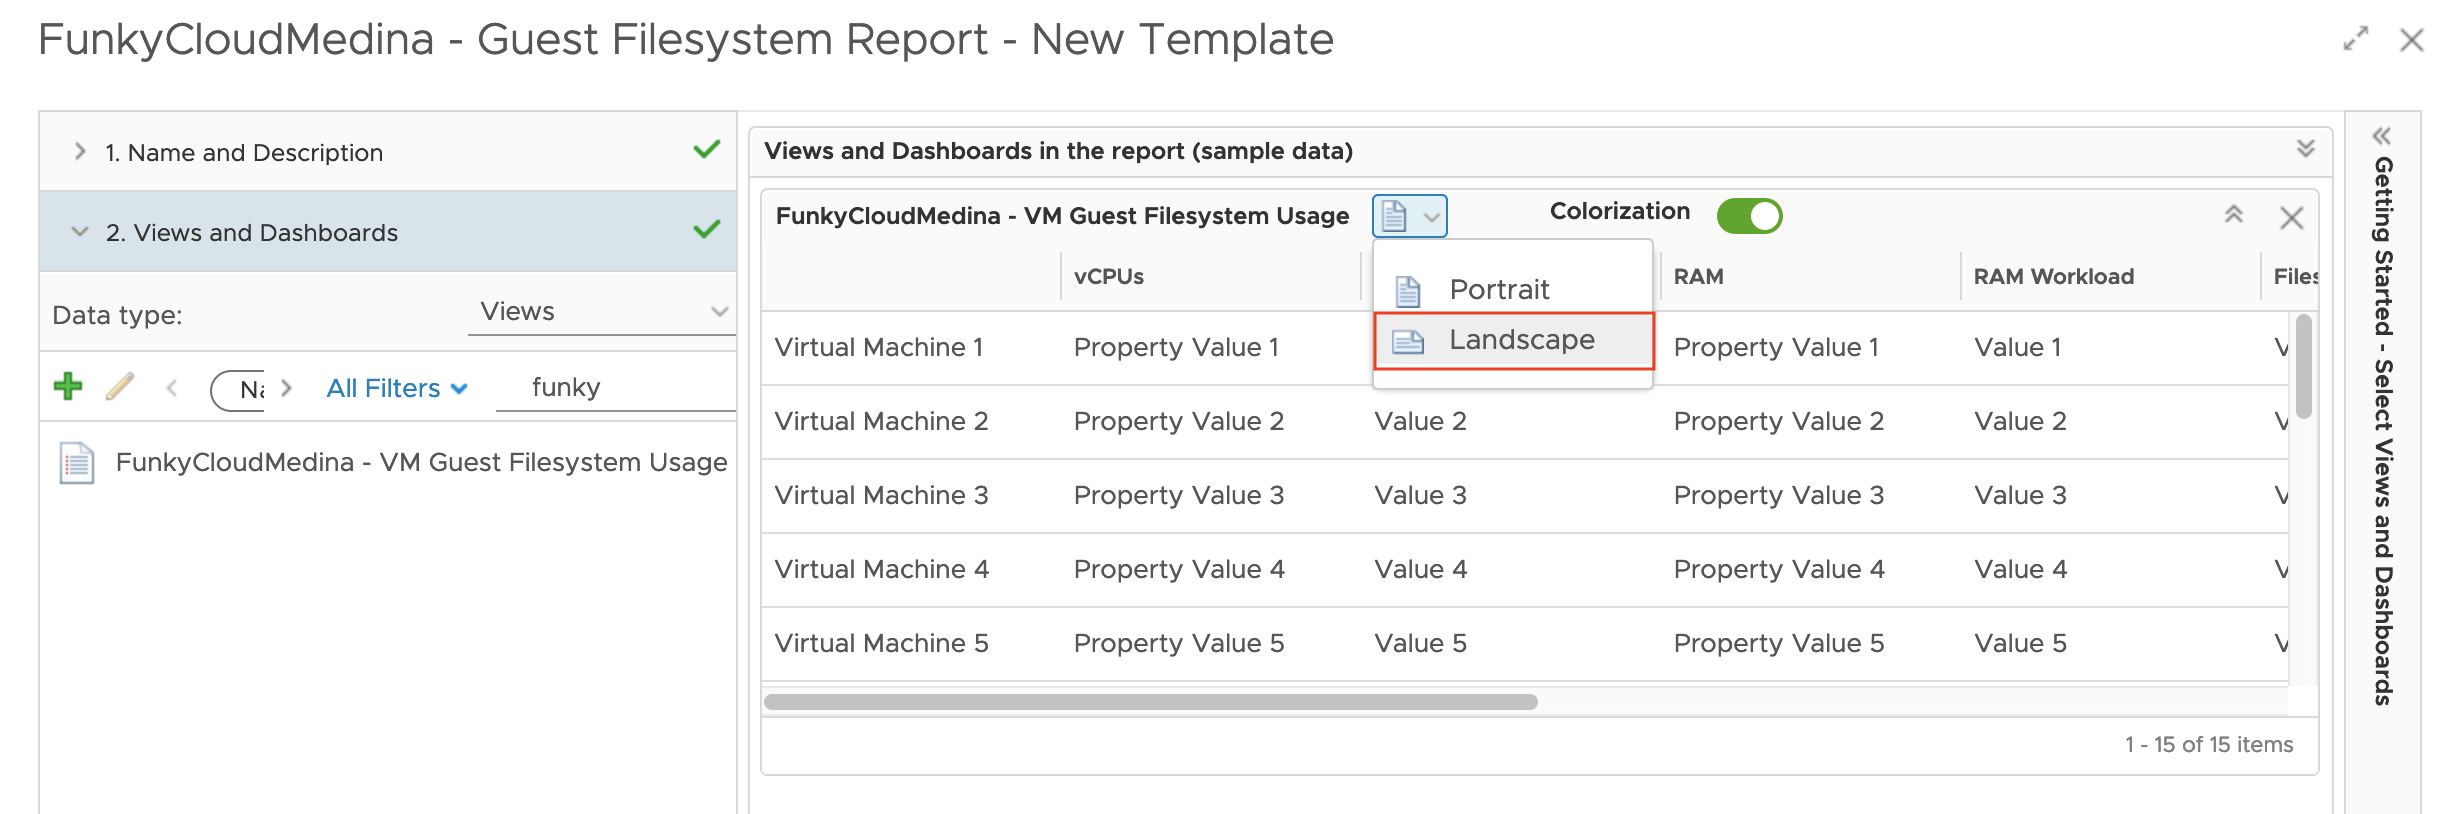
- Drag and drop the View from the list on the left to the canvas on the right.
- Use the Orientation button to change the View presentation to Landscape.
- Click the Formats tab at the bottom of the left-hand menu.
- Ensure PDF and CSV is selected.
- Click the Layout Options tab at the bottom of the left-hand menu.
- Add a Cover Page, Table of Contents, and Footer if you need it for your report.
- Click the Save button.
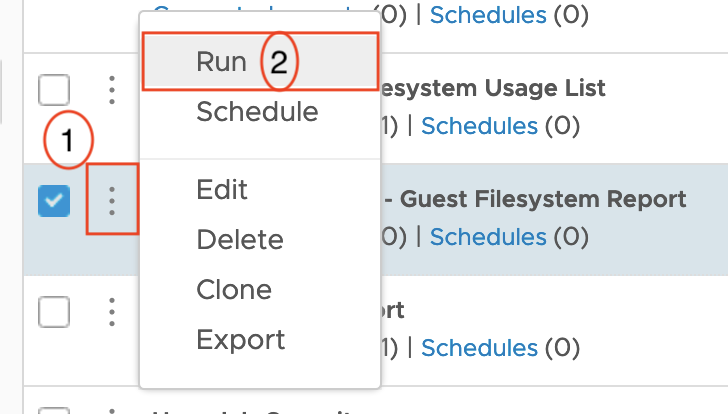
Your final report is listed amongst the other reports. From here, you can run the report.
- Click the 3-dot options button next to the report title and click Run
- From the Object Selector, select a container within the vSphere inventory that contains VMs. For my environment I want all VMs, so I expand vCenter Adapter > vSphere World and select vSphere World.
- Click the OK button.
- Click the Generated Reports tab.
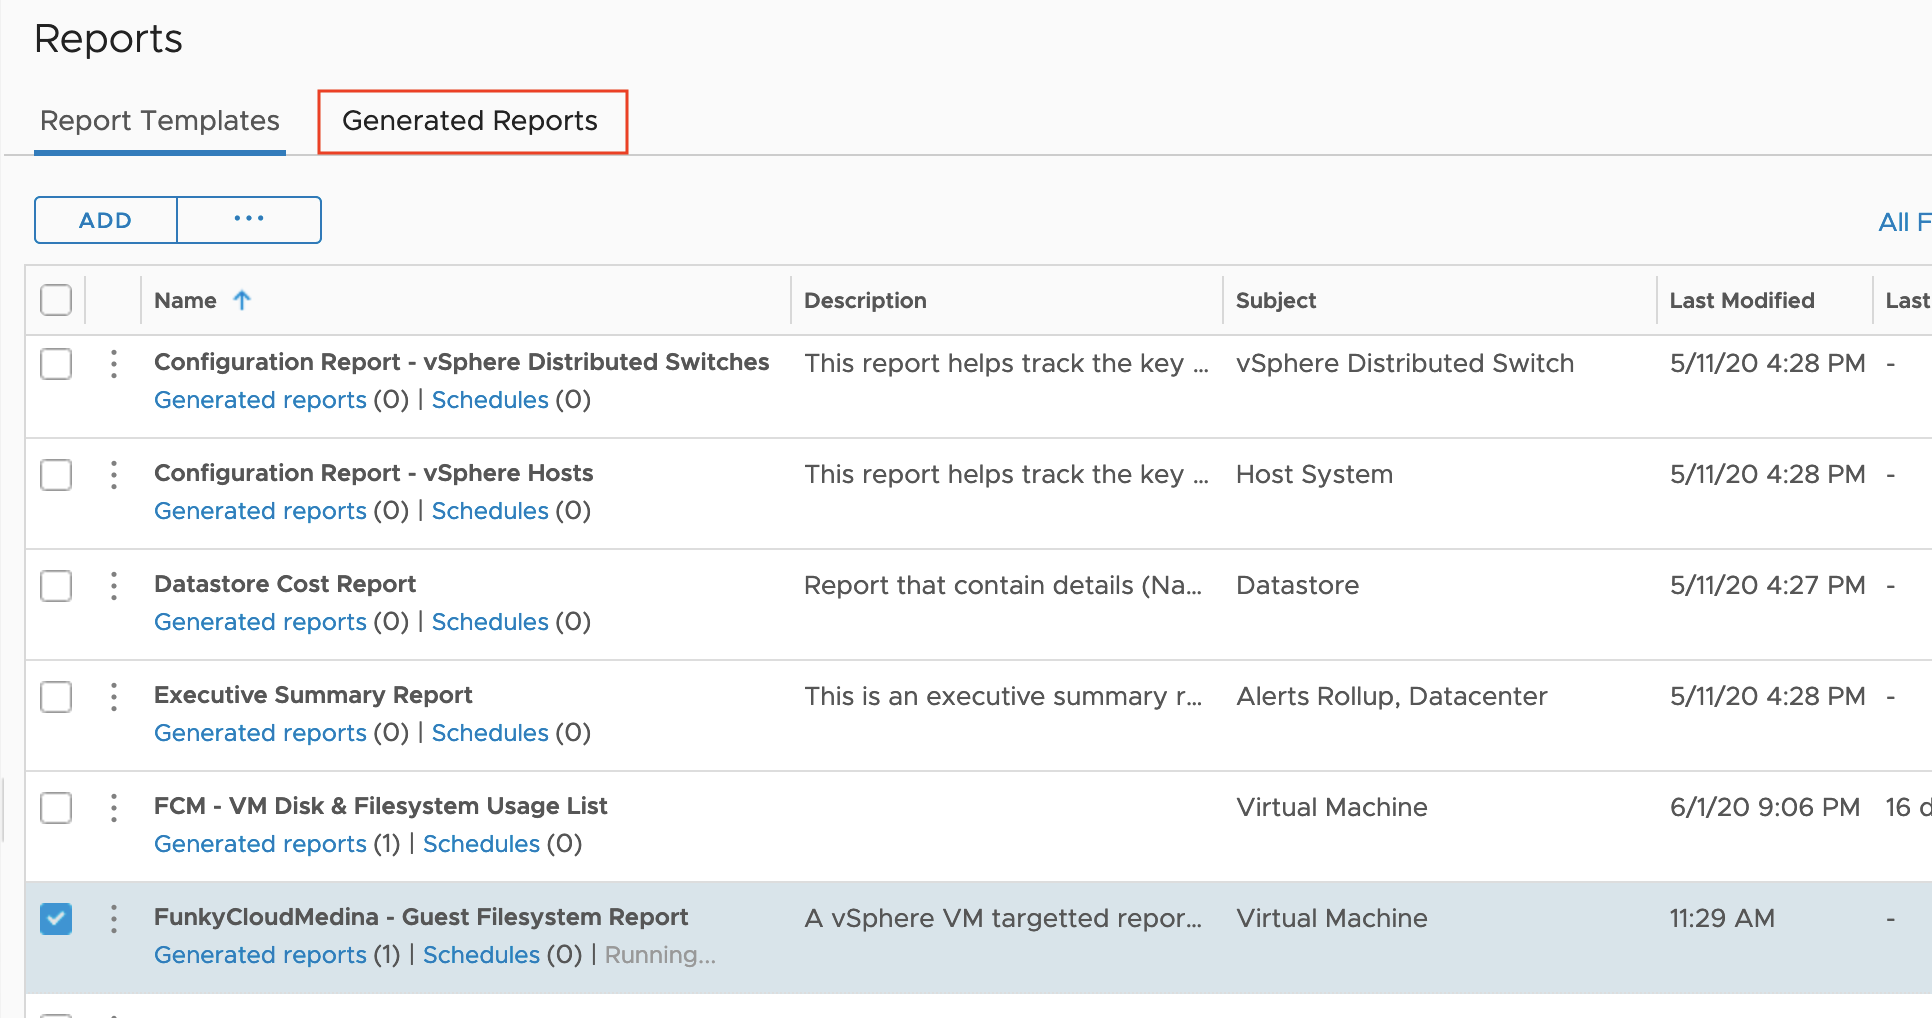 Wait until vRealize Operations has generated your report, determined by the Status column.
 - The PDF and CSV icons will become available for you to download the report. Click either icon to download.

I hope the walkthrough above has been a great introduction to not only creating Views and Reports in vRealize Operations, but demonstrated the relative ease of extracting valuable data for you, your team, and management.
Thank you for reading! If there is something you’d like to see on this blog or you have any questions about this post, please leave a comment.